All published articles of this journal are available on ScienceDirect.

Impact of Ganga Sludge-derived Organic Nutrient Management on Soil Fertility, Productivity, and Resource-use Efficiency in Wheat-Pea Intercropping Systems under a Humid Subtropical Climate
 iD
Nidhi Sharma1
Vedpriya Arya1 , 2
Vikram Khelwade1
iD
Nidhi Sharma1
Vedpriya Arya1 , 2
Vikram Khelwade1
Authors Info & Affiliations
Abstract
Introduction/Objective
This study evaluated the effects of Ganga sludge-based organic manures on soil nutrient availability, growth, yield attributes, and land-use efficiency of wheat (Triticum aestivum), pea (Pisum sativum), and their intercropping system under a humid subtropical climate.
Methods
A field experiment was conducted using a randomized block design with seven nutrient management treatments, comprising a conventional fertilization control and single or combined applications of Jaivik Prom, Pori Potash, Dharti ka Chaukidar, Jaivik Poshak, and Jaivik Khad. Growth attributes, Crop Growth Rate (CGR), yield components, Land Equivalent Ratio (LER), competition indices, and correlations between soil properties and crop performance were evaluated under sole and intercropping systems. Data were analyzed using ANOVA and LSD tests (p ≤ 0.05).
Results
Integrated organic nutrient management significantly enhanced crop performance compared with conventional fertilization. In pea, the combination of Pori Potash and Jaivik Poshak produced the highest grain yield under both intercropping (4.67 kg plot−1) and sole cropping (6.81 kg plot−1). In contrast, Jaivik Prom combined with Jaivik Khad markedly improved pod production and biomass. In wheat, the combined application of Pori Potash and Jaivik Khad resulted in the highest grain yield under sole (1.71 kg plot−1) and intercropping (1.00 kg plot−1), while Jaivik Khad alone enhanced crop growth rate, leaf area, and chlorophyll content. Pea performed better under sole cropping, whereas wheat benefited from intercropping. LER values (1.35–2.32) confirmed superior land-use efficiency of intercropping, and available phosphorus and potassium showed strong positive correlations with crop growth and yield.
Discussion
Improved crop performance was primarily associated with enhanced nutrient availability and complementary interactions between wheat and pea, particularly the legume component's facilitation of nitrogen availability.
Conclusion
The results indicate that integrated application of Ganga sludge-based organic manures, particularly combined formulations, offers a sustainable approach for nutrient recycling, soil fertility improvement, and enhanced productivity in organic and low-input cereal-legume systems.
1. INTRODUCTION
Wheat (Triticum aestivum L.) and pea (Pisum sativum L.) are globally important cereal and legume crops that play a critical role in ensuring food and nutritional security. Their cultivation, either as sole crops or within intercropping systems, has received considerable attention due to its implications for sustainable agricultural intensification. Intercropping, defined as the simultaneous cultivation of two or more crops in the same field, represents an efficient cropping strategy that enhances resource-use efficiency, stabilizes yields, and improves soil health. In particular, cereal-legume intercropping systems have been widely adopted across diverse agro-ecological regions, including India [1-3]. The ecological advantage of legume-based intercropping systems primarily lies in the biological nitrogen fixation capacity of legumes. Through symbiotic associations with rhizobia, legumes such as peas convert atmospheric nitrogen into plant-available forms, thereby contributing significantly to soil nitrogen pools. When integrated with cereal crops like wheat, this biological nitrogen input reduces dependence on synthetic fertilizers and enhances overall system productivity [4, 5]. Such complementary interactions between component crops improve nutrient cycling, optimize resource partitioning, and contribute to the resilience of cropping systems under nutrient-limited conditions.
However, the increasing global demand for food, driven by rapid population growth, has historically led to an over-reliance on inorganic fertilizers to maximize crop yields. While these inputs have substantially increased agricultural productivity, their prolonged and excessive use has resulted in the degradation of soil quality, including the decline of soil organic matter, disruption of microbial communities, and deterioration of soil structure. These challenges have necessitated a paradigm shift toward sustainable nutrient management practices, with increasing emphasis on the use of organic amendments. Organic manures are recognized not only as sources of essential plant nutrients but also as agents that improve soil physicochemical properties, enhance microbial activity, and promote long-term soil fertility, ultimately leading to sustained crop productivity [6-9]. The agronomic effectiveness of organic amendments, however, is highly dependent on their origin, composition, and application rates [10, 11]. In recent years, there has been growing interest in recycling organic wastes from agricultural residues, food processing industries, and municipal sources for the production of value-added organic fertilizers [12]. Empirical studies have demonstrated the positive effects of such organic inputs on soil fertility and crop performance across a range of crops, including potato and pea [13, 14], carrot [15], red lettuce [16], and mung bean [17]. The use of municipal and industrial wastes, particularly sewage sludge, as organic amendments in agriculture has emerged as a major management practice due to their high Organic Carbon (OC), Nitrogen (N), and Phosphorus (P) content. When properly treated, it can serve as an effective organic amendment, contributing to soil fertility enhancement and improved crop growth [12, 18]. However, its agronomic potential, particularly in diversified cropping systems such as cereal-legume intercropping, remains insufficiently explored.
Given the complementary benefits of intercropping and organic nutrient management, integrating treated sewage sludge-based organic manures into cereal-legume systems may provide a sustainable approach to enhancing crop productivity while addressing waste management challenges. However, systematic evaluation of such integrated approaches, particularly under region-specific conditions, is limited. Therefore, the present study was designed to test the hypothesis that the application of treated Ganga sludge-based organic manures in a wheat-pea intercropping system would significantly improve growth performance, resource-use efficiency, and yield compared to conventional practices. The study aims to assess the combined effects of organic nutrient inputs and intercropping on crop growth dynamics and productivity, thereby contributing to the development of sustainable and resource-efficient agricultural systems.
2. MATERIALS AND METHODS
2.1. Study Site
The study was conducted during the winter season (December–March) of 2022–2023 at the experimental farms of the Patanjali Research Institute (PRI), Haridwar, Uttarakhand, India (29°54′49″ N, 77°59′51″ E), located in the Upper Gangetic Plains Region (Agro-Climatic Zone I, ICAR). The region has a humid subtropical climate (Cwa type) with an average annual temperature of 23 °C and annual rainfall of 1262 mm. The fertile alluvial soils and prevailing climatic conditions support cereal-legume cropping systems, making the site suitable for evaluating intercropping and organic nutrient management practices.
2.2. Collection and Processing of Ganga Sludge Samples
Sludge samples were collected from the Sludge Treatment Plant (STP) located in the Jagjeetpur area of Haridwar district, Uttarakhand, India. The collected sludge was processed into five different organic fertilizer products using patented technology developed by Patanjali (Patent application number: 202211069280) at the Patanjali Organic Research Institute (PORI). The processed products included Jaivik Prom, Pori Potash, Dharti ka Chaukidar, Jaivik Poshak, and Jaivik Khad. Prior to field application, the sludge-derived fertilizers were analyzed for heavy metal concentrations (Cd, Pb, Cr, Ni, As, Hg, Cu, and Zn) following standard procedures. The concentrations of all tested elements remained below the permissible limits prescribed by the Fertilizer Control Order (FCO), Government of India, indicating that the treated Ganga sludge-based products were environmentally safe for agricultural application [19]. These manures were evaluated individually and in combinations under an intercropping system to assess their effects on growth and yield parameters of wheat and pea crops.
2.3. Composition of Organic Fertilizer Formulations
The organic fertilizer formulations evaluated in the experiment differed in their nutrient sources and biological components. The composition of the formulations used in the respective treatments was as Jaivik Prom (Formulation containing rock phosphate and plant growth-promoting bacteria (PGPB)), PORI Potash (Potassium-rich formulation derived from molasses, containing 18% K2O), Dharti ka Chaukidar (Formulation based on Jaivik Khad, supplemented with neem oil and neem cake), Jaivik Khad (Organic manure fortified with potassium-mobilizing bacteria and phosphate-solubilizing bacteria) and Jaivik Poshak (Mycorrhiza-based granular biofertilizer). Jaivik” in the product names indicates that the product is made from natural ingredients without synthetic chemicals or pesticides.
2.4. Experimental Design and Field Experimentation
Healthy and uniform seeds of wheat (PBW226 variety sourced from Divya Beej of Patanjali Organic Research Institute) and pea (Wonder 10 produced and supplied by Nath Bio-Genes (I) Ltd.) used for the field experiment were treated before sowing with a bio-pesticide formulation containing Trichoderma viride and Pseudomonas fluorescens (5 mL L−1 each) by soaking overnight to prevent soil-borne diseases. The experiment was laid out in a Randomized Block Design (RBD) with eight treatments and three independent replications, resulting in 24 experimental plots. Three replications were selected to provide independent experimental units within the RBD and to account for field-level spatial variability while maintaining the feasibility of the field experiment. The total experimental area comprised 24 plots, with each plot measuring 4 × 2 m (8 m2). Pea seeds were sown at a spacing of 10 cm (seed-to-seed), whereas wheat was sown at a seed rate of 83.5 kg/ha. Wheat and peas were planted in a 2:1 row ratio, with two rows of wheat alternating with one row of peas. The treatments consisted of different organic fertilizer applications as follows: To (Control with FYM only), T1 (Jaivik Prom 100 kg acre−1), T2 (Pori Potash 100 kg acre−1), T3 (Dharti ka Chaukidar 10 kg acre−1), T4 (Jaivik Poshak 7 kg acre−1), T5 (Jaivik Khad 80 kg acre−1), T6 (Jaivik Prom + Jaivik Khad at 50 + 40 kg acre−1), and T7 (Pori Potash + Jaivik Poshak at 50 + 3.5 kg acre−1). Each organic manure was applied at 30-day intervals after sowing, according to the treatment and recommended application rates. Soil moisture was maintained uniformly at field capacity throughout the experimental period.
2.5. Measuring Variables
2.5.1. Soil Analysis
Soil samples were collected randomly from each treatment plot at a depth of 0–200 mm at the time of harvest. The samples were placed in sterile, sealed plastic bags and transported immediately to the laboratory for analysis. After removing plant debris and gravel, the soil samples were homogenized and passed through a 2 mm sieve. Physicochemical properties, including soil pH, Organic Carbon (OC), total Nitrogen (N), Phosphorus (P), and Potassium (K), were determined using standard procedures. Soil pH was measured using a pH electrode at a soil-to-water ratio of 1:5. Total nitrogen was determined using the Kjeldahl method, while phosphorus content was analyzed using Olsen’s method [20]. Potassium content was measured using a flame photometer. Available Nitrogen (AN), Phosphorus (AP), and Potassium (AK) were analyzed at the harvest stage by the Central Laboratory, Patanjali Food and Herbal Park Pvt. Ltd. (NABL-accredited).
2.5.2. Plant Growth and Yield Parameters
Growth and yield parameters were recorded separately for pea and wheat crops, considering their different crop durations. In pea, growth parameters including plant height (cm), shoot biomass (g), leaf area (cm2), dry matter accumulation (g), and chlorophyll content were measured at 30 Days After Sowing (DAS), while yield attributes were recorded at 60 DAS. In wheat, growth parameters were recorded at 60 DAS, whereas yield attributes such as spike length, 100-seed weight, number of seeds per spike, and yield per plot were measured at 90 DAS. A total of nine plants were randomly selected from each treatment and replication for recording observations. Chlorophyll content was determined using a SPAD meter and expressed as SPAD values.
2.5.3. Growth Indices and Intercropping Efficiency
Crop growth rate (CGR) was calculated using the following formula in Eq. (1):
where W1 and W2 represent initial and final fresh weights, respectively, and t2 − t1 denotes the time interval in days.
The Land Equivalent Ratio (LER) was calculated to evaluate intercropping efficiency [Willey et al. 1979] using Eq. (2):
where Yₚ-IC and Yₚ-SC represent the yields of intercropped and sole pea, respectively, and YO-IC and YO-SC represent the yields of intercropped and sole wheat, respectively. LER values greater than 1 indicate a yield advantage of intercropping over sole cropping.
Aggressivity (A) was calculated to determine the dominance of one crop over the other in the intercropping system [21] using the following Eq. (3):
(Y(pea mix) / Y(pea,sole) × Z(pea))
Where Z(wheat) and Z(pea) are the proportions of wheat and pea sown in the intercropping system. In the present study, wheat and pea were grown in a 2:1 row ratio; therefore, Z (wheat)= 2/3 and Z (pea) = 1/3. A positive value of aggressivity indicates dominance of wheat over pea, while a negative value indicates dominance of pea over wheat.
The Competitive Ratio (CR) was calculated to assess the degree of competition between the component crops as follows [22] in Eq. (4):
Where: LER(wheat) = Y(wheat mix) / Y(wheat sole)
LER(pea) = Y(pea mix) / Y(pea sole)
And Z pea and Z wheat denote their respective sown proportions in the intercropping system. A CR value greater than 1 indicates that wheat is more competitive than pea, whereas a value less than 1 indicates the opposite.
2.6. Statistical Analysis
All data collected were classified and processed in Microsoft Excel and subsequently analyzed using R version 4.3.1 (R Core Team, 2022). Prior to statistical analysis, the assumptions of normality and homogeneity of variance were tested. The effects of treatments, cropping pattern, and their interaction on the studied parameters were evaluated using two-way Analysis of Variance (ANOVA). Whenever significant differences were detected, mean separation was performed using the Least Significant Difference (LSD) test at the 5% probability level employing the “agricolae” package [23]. Pearson's correlation analysis was performed to examine relationships among variables using the “metan” package [24]. All statistical tests were considered significant at p ≤ 0.05, and the results are presented as mean ± Standard Deviation (SD).
3. RESULTS
3.1. Soil Chemical Properties
The application of organic fertilizers significantly altered soil chemical properties across different cropping systems (Tables 1-3). Organic fertilizer applications resulted in a significant increase in soil Available Phosphorus (AP) and Available Potassium (AK) (P < 0.05). In all three systems, AP was highest under the T6 treatment, while AK was maximized under T7. Soil Available Nitrogen (AN) did not show significant variation among treatments, although slight fluctuations were observed depending on crop type. Similarly, soil Total Nitrogen (TN), Total Phosphorus (TP), and Total Potassium (TK) did not exhibit marked differences across treatments. However, both total and available nutrient contents were generally higher in treated plots compared to the control, indicating a positive influence of organic fertilizers on soil chemical properties.
| Treatment |
TN (g kg-1) |
TP (g kg-1) |
TK (g kg-1) |
AN (mg kg-1) |
AP (mg kg-1) |
AK (mg kg-1) |
|---|---|---|---|---|---|---|
| T0 | 4.10±0.25 | 0.66±0.12 | 81.85±0.61 | 192.84±10.24 | 215.8±9.4 | 1161.72±31.01 |
| T1 | 2.42±0.30 | 0.68±0.10 | 82.64±1.44 | 195.90±11.67 | 287.45±13.9** | 1238.06±55.79* |
| T2 | 3.26±0.12 | 0.69±0.21 | 81.96±0.84 | 187.76±3.12 | 258.8±12.9* | 1568.17±32.10** |
| T3 | 3.47±0.08 | 0.73±0.20 | 83.12±0.71 | 184.54±15.22 | 224.18±15.0 | 1287.96±4.68** |
| T4 | 3.56±0.28 | 0.74±0.26 | 82.18±0.51 | 183.70±3.66 | 343.18±18.7** | 2067.75±12.13** |
| T5 | 3.70±0.07 | 0.58±0.04 | 81.84±0.56 | 189.34±6.80 | 268.5± 4.8* | 1239.63±23.32* |
| T6 | 3.40±0.26 | 0.55±0.01 | 82.59±0.88 | 177.96±5.60 | 442.12±31.0** | 1309.73±30.67** |
| T7 | 3.28±0.14 | 0.50±0.03 | 83.25±0.59 | 182.30±3.39 | 288.85±8.8** | 3056.71±22.67** |
| Treatment |
TN (g kg−1) |
TP (g kg−1) |
TK (g kg−1) |
AN (mg kg−1) |
AP (mg kg−1) |
AK (mg kg−1) |
|---|---|---|---|---|---|---|
| T0 | 4.85±0.22 | 0.70±0.10 | 82.10±0.70 | 210.45±9.80 | 225.30±10.5 | 1205.40±30.20 |
| T1 | 3.10±0.28 | 0.75±0.12 | 82.80±1.20 | 220.60±10.40 | 310.20±12.8 | 1320.75±45.60 |
| T2 | 3.60±0.15 | 0.72±0.18 | 82.50±0.90 | 205.30±5.20 | 275.40±11.6 | 1685.30±40.10 |
| T3 | 3.75±0.10 | 0.78±0.15 | 83.40±0.65 | 198.60±12.30 | 240.10±14.2 | 1385.20±10.40 |
| T4 | 3.95±0.20 | 0.80±0.20 | 82.60±0.55 | 200.10±4.50 | 365.40±16.5 | 2150.80±15.20 |
| T5 | 4.20±0.08 | 0.62±0.05 | 82.30±0.60 | 208.40±6.20 | 280.50±6.8 | 1350.90±20.30 |
| T6 | 3.90±0.18 | 0.60±0.03 | 82.90±0.75 | 195.20±5.80 | 460.80±28.0 | 1420.60±28.40 |
| T7 | 3.70±0.12 | 0.58±0.04 | 83.50±0.60 | 198.80±4.20 | 300.60±9.5 | 3200.40±25.10 |
| Treatment |
TN (g kg−1) |
TP (g kg−1) |
TK (g kg−1) |
AN (mg kg−1) |
AP (mg kg−1) |
AK (mg kg−1) |
|---|---|---|---|---|---|---|
| T0 | 4.30±0.20 | 0.68±0.11 | 82.00±0.65 | 200.10±8.90 | 220.40±9.80 | 1180.50±28.60 |
| T1 | 2.80±0.25 | 0.70±0.10 | 82.70±1.10 | 205.30±9.60 | 295.20±11.4 | 1305.40±40.20 |
| T2 | 3.30±0.10 | 0.71±0.19 | 82.30±0.85 | 190.40±4.10 | 265.30±10.2 | 1600.20±35.60 |
| T3 | 3.50±0.09 | 0.75±0.18 | 83.20±0.60 | 188.20±11.50 | 235.80±13.8 | 1355.10±9.50 |
| T4 | 3.65±0.22 | 0.78±0.22 | 82.40±0.50 | 190.10±3.80 | 350.60±17.2 | 2105.30±14.80 |
| T5 | 3.80±0.06 | 0.60±0.04 | 82.10±0.55 | 195.40±5.60 | 275.10±5.5 | 1300.40±18.70 |
| T6 | 3.55±0.20 | 0.58±0.02 | 82.80±0.70 | 185.30±4.90 | 430.20±25.6 | 1380.50±26.20 |
| T7 | 3.40±0.13 | 0.55±0.03 | 83.40±0.55 | 188.60±3.70 | 295.80±8.20 | 3100.60±20.40 |
In sole cropping of Wheat (Triticum aestivum) (Table 1), nutrient availability followed a pattern that was consistent with fertilizer composition. The highest AP (442.12 mg kg−1) was observed under T6, suggesting a synergistic effect of combined organic inputs and microbial activity. Similarly, AK was significantly enhanced under T7 (3056.71 mg kg−1), reflecting the influence of potassium-rich amendments such as Pori Potash fertilizer. However, TN, TP, and TK remained relatively stable, indicating that total nutrient pools are less responsive to short-term fertilization.
Under sole cropping of Pea (Pisum sativum) (Table 2), comparatively higher TN and AN values were recorded than in wheat, which can be attributed to biological nitrogen fixation. Available phosphorus and potassium followed trends similar to wheat, with maximum AP under T6 and highest AK under T7. The enhancement of AP under treatments containing biofertilizers and mycorrhizal inputs (T4, T6) indicates improved phosphorus solubilization and uptake efficiency. Despite these increases in available nutrients, total nutrient fractions remained relatively unchanged, suggesting that nutrient transformations occurred primarily within the available pool.
In the intercropping system of wheat and pea (Table 3), nutrient values were generally intermediate between sole crops. Available nitrogen was slightly lower than in sole pea but comparable to wheat, indicating rapid utilization of biologically fixed nitrogen by the associated cereal crop. Available phosphorus and potassium again showed significant increases under T6 and T7 treatments, respectively, confirming the consistent effectiveness of combined organic inputs across cropping systems. The intercropping system demonstrated a stabilizing effect on soil nutrient dynamics, maintaining moderate levels of both total and available nutrients.
The use of organic fertilizers led to notable improvements in soil nutrient status, particularly increasing AP and AK levels (Tables 1-3), which is consistent with earlier findings reported in the literature. The increase in AP can be attributed to enhanced microbial activity, organic acid production, and solubilization of insoluble phosphates, especially in treatments containing rock phosphate and phosphate-solubilizing microorganisms. Similarly, the increase in AK is linked to potassium-rich inputs and microbial-mediated release of non-exchangeable potassium fractions.
Soil TN, TP, and TK did not show significant variation under different treatments, likely due to the slow and gradual release of nutrients from organic sources. Unlike chemical fertilizers, organic amendments release nutrients over time, resulting in limited short-term changes in total nutrient pools. Furthermore, phosphorus mobility in soil is generally low and strongly influenced by soil properties and pH, which may explain the minimal variation in TP despite significant changes in AP.
Interestingly, soil AN remained relatively unaffected by treatments, which may be due to the slower mineralization rates of organic nitrogen and its dependence on environmental factors such as temperature, moisture, and microbial activity. In contrast, the presence of leguminous crops like Pea (Pisum sativum) contributed to relatively higher nitrogen availability, although this effect was moderated in intercropping systems due to increased nutrient uptake by Wheat (Triticum aestivum).
Overall, the results indicate that while total nutrient fractions remain relatively stable, organic fertilizer applications significantly enhance nutrient availability, particularly phosphorus and potassium, thereby improving soil fertility status. The combined treatments (T6 and T7) were found to be most effective across all cropping systems, highlighting the importance of integrated nutrient management strategies for sustainable agriculture.
3.2. Effect of Ganga Sludge-based Organic Fertilizers on Growth Parameters of Pea and Wheat under Sole and Intercropping Systems
The application of Ganga sludge-based organic fertilizers significantly influenced the growth performance of both pea and wheat under sole and intercropping systems at different growth stages, i.e., 30 DAS for pea (Table 4) and 60 DAS for wheat (Table 5). Two-way analysis of variance revealed that fertilizer treatments, cropping pattern, and their interaction effects were highly significant (p ≤ 0.05) for all major growth parameters, including shoot biomass, root biomass, shoot length, root length, leaf area, and chlorophyll content. These findings clearly indicate that plant response to organic nutrient inputs was not only treatment-dependent but also strongly modulated by the cropping system, highlighting the importance of nutrient–crop interaction dynamics in intercropping systems.
| Treatment | Shoot biomass (%) | Root Biomass (%) | Shoot Length (cm) |
Root Length (cm) |
Leaf area (cm2) |
Chlorophyll content | ||||||
|---|---|---|---|---|---|---|---|---|---|---|---|---|
| Intercropping | Sole | Intercropping | Sole | Intercropping | Sole | Intercropping | Sole | Intercropping | Sole | Intercropping | Sole | |
| T0 | 9.26±0.86 d | 10.43±0.32 d | 5.43±0.87 d | 7.83±0.32 d | 10.28±0.40 d | 17.44±0.69 c | 7.67±0.86 c | 10.22±1.35 c | 3.50±0.06 c | 3.08±0.26 c | 39.36±1.60 c | 38.30±2.07 c |
| T1 | 11.88±0.53 ab | 14.91±0.18 b | 7.29±0.66 ab | 15.66±7.80 a | 15.00±0.53 b | 20.67±1.86 a | 10.44±0.48 ab | 12.33±0.88 ab | 4.97±0.87 ab | 4.47±0.29 b | 42.08±0.19 ab | 39.03±1.79 bc |
| T2 | 10.78±0.62 bc | 10.33±6.49 d | 6.55±0.63 bc | 7.81±5.02 d | 14.56±0.35 bc | 19.67±0.88 ab | 9.78±0.08 b | 11.89±1.07 ab | 4.83±0.37 ab | 4.49±0.60 b | 39.54±0.92 bc | 39.98±5.17 b |
| T3 | 11.26±0.19 abc | 15.13±0.09 b | 7.07±0.66 ab | 12.93±0.94 b | 16.11±0.68 ab | 20.07±2.00 a | 11.22±0.35 a | 13.44±1.67 a | 4.93±0.91 ab | 4.76±0.12 ab | 40.90±0.90 bc | 38.29±1.97 c |
| T4 | 10.99±0.91 bc | 14.71±1.25 b | 6.96±0.34 ab | 10.10±1.80 c | 16.33±0.18 ab | 20.72±2.43 a | 9.89±0.50 b | 13.11±2.17 a | 4.83±0.07 ab | 6.17±2.87 a | 40.54±0.81 bc | 39.92±5.33 b |
| T5 | 11.70±0.05 ab | 15.93±0.67 ab | 6.93±0.33 ab | 10.60±0.39 c | 17.11±0.50 a | 19.44±0.39 ab | 10.50±0.58 ab | 11.82±1.75 ab | 6.33±0.65 a | 4.43±0.12 b | 43.71±2.68 a | 39.38±4.27 bc |
| T6 | 11.78±0.11 ab | 17.67±3.22 a | 7.60±0.28 a | 11.35±1.02 bc | 15.00±0.73 b | 20.89±3.34 a | 10.72±0.92 ab | 13.00±1.73 a | 5.03±0.80 ab | 4.64±0.07 ab | 43.13±0.58 a | 39.77±1.27 b |
| T7 | 11.83±0.13 ab | 15.46±0.08 b | 7.90±0.64 a | 11.65±1.78 bc | 15.22±0.95 b | 20.44±2.67 a | 11.61±0.42 a | 12.00±0.17 ab | 5.63±0.64 ab | 4.46±1.10 b | 43.90±1.22 a | 39.91±2.82 b |
| Treatment | Shoot Biomass (%) | Root Biomass (%) | Shoot Length (cm) | Root Length (cm) | Leaf Area (cm2) | Chlorophyll | ||||||
|---|---|---|---|---|---|---|---|---|---|---|---|---|
| Sole | Intercropping | Sole | Intercropping | Sole | Intercropping | Sole | Intercropping | Sole | Intercropping | Sole | Intercropping | |
| T0 | 35.73±3.07 d | 35.78±0.44 e | 37.83±6.74 d | 45.38±8.50 c | 57.56±4.35 d | 69.78±4.03 d | 8.44±0.51 d | 10.11±1.07 c | 15.13±8.29 d | 30.36±2.96 d | 15.66±6.42 d | 27.96±4.72 c |
| T1 | 40.41±1.27 b | 44.37±1.76 c | 49.79±6.91 bc | 51.96±6.13 b | 70.44±2.91 bc | 72.56±1.50 bc | 10.56±1.35 c | 14.00±4.62 ab | 32.62±6.44 bc | 36.84±2.27 bc | 21.37±4.65 c | 28.04±4.94 c |
| T2 | 40.34±0.93 b | 43.14±3.63 cd | 42.63±7.39 cd | 47.91±2.96 bc | 68.22±5.39 c | 72.22±2.04 bc | 12.00±2.52 b | 14.22±2.22 ab | 33.86±2.34 b | 40.13±1.70 ab | 27.78±7.56 b | 32.26±4.10 b |
| T3 | 36.71±2.46 cd | 39.97±2.47 d | 40.48±6.50 cd | 49.79±4.63 bc | 69.33±2.33 bc | 70.78±4.53 cd | 10.11±1.35 c | 14.89±0.51 a | 26.79±1.54 c | 32.66±3.28 cd | 26.98±6.02 b | 28.69±3.87 c |
| T4 | 39.54±3.08 bc | 46.05±5.64 b | 57.09±8.49 b | 48.33±1.46 bc | 72.89±1.17 ab | 75.22±3.93 a | 10.33±1.67 c | 14.44±0.51 a | 34.20±1.68 b | 36.27±0.34 bc | 25.90±1.74 b | 28.64±3.91 c |
| T5 | 36.84±2.71 cd | 41.07±5.48 cd | 48.11±4.85 bc | 47.51±2.21 bc | 72.22±3.72 ab | 73.44±1.02 b | 10.89±1.26 bc | 14.56±1.68 a | 36.00±3.08 a | 41.97±2.98 a | 27.71±2.75 b | 38.41±5.40 a |
| T6 | 37.65±2.78 c | 43.96±3.14 c | 42.83±7.85 cd | 52.69±5.70 b | 73.56±5.27 a | 74.44±0.51 ab | 10.00±1.86 c | 14.00±2.65 ab | 29.58±1.99 c | 36.39±4.18 bc | 21.91±1.28 c | 28.20±2.42 c |
| T7 | 41.10±1.99 a | 49.91±4.04 a | 64.10±9.10 a | 52.12±3.85 b | 72.22±2.84 ab | 74.56±5.67 ab | 10.56±1.07 c | 14.78±1.17 a | 30.82±5.78 bc | 37.37±5.04 bc | 31.00±4.07 a | 33.11±3.50 b |
A detailed evaluation of pea growth parameters (Table 4) demonstrated that Ganga sludge-based fertilizers markedly enhanced plant performance under both cropping systems, although relatively higher values were generally recorded under sole cropping. This trend suggests reduced interspecific competition and greater availability of resources such as light, water, and nutrients under monocropping conditions. Among the treatments, T6 consistently recorded the highest shoot biomass (17.67% in sole and 11.78% in intercropping), followed by T5 and T7, whereas the control (T0) exhibited the lowest values. Root biomass showed a similar pattern, with T6 and T7 promoting superior below-ground development, indicating improved nutrient acquisition capacity.
Shoot length and root length were also significantly enhanced under fertilized treatments. The maximum shoot length was observed in T4 (20.72 cm in sole cropping) and T5 (17.11 cm in intercropping), while treatments T3 and T7 exhibited greater root elongation across both systems, reflecting enhanced soil exploration. Leaf area, a key determinant of photosynthetic efficiency, was significantly higher in T5, T6, and T7, with the maximum value recorded in T5 (6.33 cm2 under intercropping), indicating improved canopy development. Chlorophyll content followed a similar trend, with T5, T6, and T7 exhibiting higher SPAD values, suggesting enhanced nitrogen assimilation and photosynthetic activity. Overall, T5–T7 emerged as the most effective treatments for promoting pea growth, with T6 showing particular superiority in biomass accumulation.
In contrast to pea, wheat exhibited comparatively better performance under intercropping conditions for several growth parameters (Table 5), indicating a complementary interaction between wheat and pea. Shoot biomass was highest in T7 under intercropping (49.91%), followed by T4 and T1, while the control recorded the lowest values. Root biomass was also maximized in T7 (64.10% in sole cropping), reflecting enhanced root proliferation and nutrient uptake. Shoot length showed significant improvement under fertilized treatments, with T6 (73.56 cm in sole) and T4 (75.22 cm in intercropping) recording the highest values. Root length was notably higher in treatments T3, T4, T5, and T7 under intercropping, indicating improved soil resource utilization.
Leaf area and chlorophyll content further supported the superior performance of wheat under integrated nutrient management. The highest leaf area was recorded in T5 (36.00 cm2 in sole and 41.97 cm2 in intercropping), while chlorophyll content was maximum in T7 under sole cropping (31.00 SPAD) and in T5 under intercropping (38.41 SPAD). The relatively higher chlorophyll content and biomass under intercropping suggest a positive facilitative effect, possibly due to biological nitrogen fixation by pea, which enhanced nitrogen availability for wheat, thereby improving its physiological efficiency.
The interaction effects between fertilizer treatments and cropping patterns were further elucidated through heatmap visualization (Fig. 1), which provided an integrated comparison of treatment performance across all growth parameters. The gradation from lowest to highest response clearly demonstrated treatment-specific variability and reinforced the statistical findings. In pea, T6 consistently achieved the highest category for shoot biomass and chlorophyll content, along with high performance in root biomass, shoot length, and leaf area. T5 also showed excellent performance, particularly attaining the highest category for shoot length and leaf area, while T7 was notably superior in root biomass and root length. In wheat, T7 emerged as the most effective treatment, achieving the highest category for shoot biomass, root biomass, and chlorophyll content, whereas T5 dominated in leaf area and chlorophyll content under intercropping. Treatments T4 and T6 performed strongly in shoot length, while T3 was particularly effective in enhancing root length. In both crops, the control (T0) consistently exhibited the lowest performance across all parameters, underscoring the critical role of nutrient supplementation.
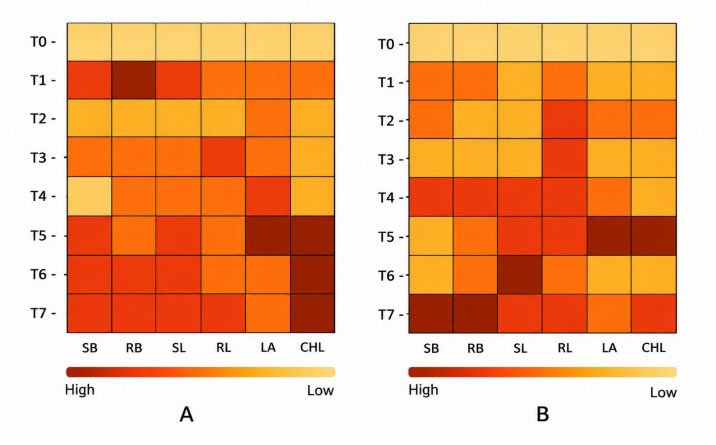
Comparative performance of organic fertilizer treatments (T0–T7) on different growth parameters of pea (A) and wheat (B). Color intensity represents relative performance levels across parameters.SB: Shoot biomass; RB: Root Biomass; SL: Shoot Length; RL: Root Length; LA: Leaf Area; CHL: Chlorophyll.
Collectively, the results demonstrate that Ganga sludge-based organic fertilizers significantly improved growth parameters of both pea and wheat, with treatments T5, T6, and T7 consistently outperforming others. While pea showed relatively better growth under sole cropping, wheat benefited more from intercropping, indicating a complementary interaction between the two species. The integration of optimized organic nutrient inputs with intercropping systems thus enhances plant growth, resource-use efficiency, and overall system productivity. These findings strongly support the potential of Ganga sludge-derived organic manures as sustainable nutrient sources for improving crop performance and soil fertility under diversified cropping systems.
3.3. Effect of Cropping Pattern on Growth Parameters of Pea and Wheat
The comparison of cropping patterns revealed a distinct and crop-specific influence on the growth parameters of both pea and wheat. In pea (Table 6, Fig. 2), sole cropping recorded significantly higher values for all measured growth attributes compared to intercropping, as indicated by different significance letters (p ≤ 0.05). Shoot biomass (14.32%) and root biomass (10.99%) were markedly higher under sole cropping than under intercropping (11.18% and 6.97%, respectively). Similarly, shoot length (19.92 cm) and root length (12.23 cm) were significantly greater in sole cropping compared to intercropping (14.95 cm and 10.23 cm). Leaf area and chlorophyll content also followed the same trend, with higher values in sole cropping (5.01 cm2 and 41.65 SPAD) than in intercropping (4.56 cm2 and 39.32 SPAD). These results clearly indicate that pea growth was significantly suppressed under intercropping conditions, likely due to interspecific competition for nutrients, light, and moisture during the early growth stage.
| Parameter | Pea (Sole) | Pea (Intercropping) | Wheat (Sole) | Wheat (Intercropping) |
|---|---|---|---|---|
| Shoot biomass (%) | 14.32ᵃ | 11.18ᵇ | 38.54ᵇ | 43.03ᵃ |
| Root biomass (%) | 10.99ᵃ | 6.97ᵇ | 47.86ᵃ | 49.46ᵃ |
| Shoot length (cm) | 19.92ᵃ | 14.95ᵇ | 69.56ᵇ | 72.88ᵃ |
| Root length (cm) | 12.23ᵃ | 10.23ᵇ | 10.36ᵇ | 13.88ᵃ |
| Leaf area (cm2) | 5.01ᵃ | 4.56ᵇ | 29.88ᵇ | 36.50ᵃ |
| Chlorophyll (SPAD) | 41.65ᵃ | 39.32ᵇ | 24.79ᵇ | 30.66ᵃ |
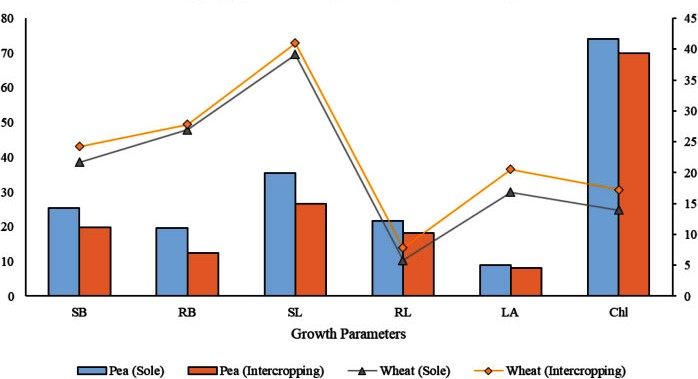
Effect of cropping pattern on growth parameters of pea and wheat. Values represent mean performance under sole and intercropping systems averaged across fertilizer treatments. SB: Shoot biomass; RB: Root Biomass; SL: Shoot Length; RL: Root Length; LA: Leaf Area; Chl: Chlorophyll.
In contrast, wheat exhibited improved performance under intercropping with pea. Intercropping resulted in significantly higher shoot biomass (43.03%), shoot length (72.88 cm), root length (13.88 cm), leaf area (36.50 cm2), and chlorophyll content (30.66 SPAD) compared to sole cropping (38.54%, 69.56 cm, 10.36 cm, 29.88 cm2, and 24.79 SPAD, respectively). However, root biomass did not differ significantly between sole (47.86%) and intercropping (49.46%), indicating a relatively stable below-ground biomass allocation irrespective of cropping system.
The enhanced growth of wheat under intercropping may be attributed to complementary interactions between wheat and pea, particularly the contribution of biological nitrogen fixation by pea, which improves nutrient availability in the rhizosphere. Conversely, the reduced growth of pea under intercropping highlights its sensitivity to competitive stress imposed by wheat. Overall, the results suggest that while sole cropping is more favorable for pea growth, wheat benefits significantly from intercropping, indicating a complementary relationship that can be exploited to improve overall system productivity and resource use efficiency.
3.4. Crop Growth Rate (CGR)
The Crop Growth Rate (CGR) of both pea and wheat exhibited substantial variation across treatments under sole and intercropping systems, reflecting the differential influence of nutrient composition and biological inputs on crop productivity. Overall, wheat demonstrated consistently higher CGR values than pea under intercropping conditions, indicating its stronger growth potential and competitive advantage in the intercropping system (Fig. 3).
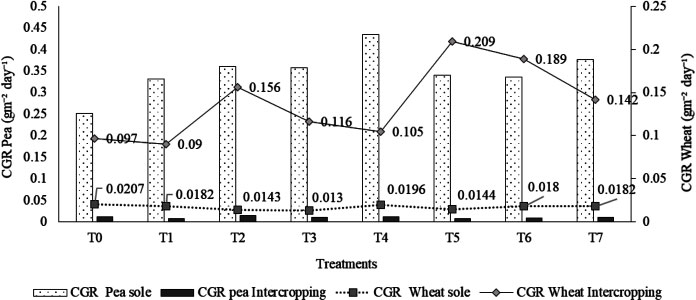
Crop Growth Rate (CGR) of pea and wheat under sole and intercropping systems across different treatments (T0–T7). Values represent the CGR of pea (mix and sole) and wheat (mix and sole), illustrating variations in growth performance under different cropping systems.
Under intercropping, the highest CGR for wheat was recorded in treatment T5 (0.209), followed by T6 (0.189). This enhanced growth can be attributed to the balanced and readily available nutrient supply in these treatments. In particular, T5 (Javik Khad), being a source of organic NPK along with beneficial microbial populations, likely improved nutrient mineralization, soil structure, and microbial activity, thereby promoting rapid biomass accumulation in wheat. Similarly, T6, which combines organic potassium fertilizer with Javik Khad, may have further enhanced physiological processes such as enzyme activation, osmotic regulation, and translocation of assimilates, leading to improved growth rates. The relatively high CGR under T2 (organic K fertilizer) also highlights the critical role of potassium in regulating stomatal activity, photosynthesis, and stress tolerance, which collectively contribute to increased biomass production.
In contrast, pea exhibited comparatively lower CGR under intercropping, with the highest value observed in T2 (0.0143), followed by T0 and T4 (0.012). The improved performance under T2 may be linked to the role of potassium in enhancing nodulation efficiency and nitrogen fixation, thereby indirectly supporting pea growth. However, the overall reduced CGR of pea in intercropping suggests competitive suppression by wheat, particularly for light, nutrients, and space.
Under sole cropping conditions, a different trend was observed. Pea recorded its highest CGR in T4 (0.435), followed by T7 (0.376), indicating a strong positive response to mycorrhizal association. The presence of VA mycorrhiza in T4 likely enhanced phosphorus uptake, root surface area, and water absorption, thereby significantly improving growth. Similarly, T7, which combines phosphorus fertilizer with mycorrhiza, appears to have created a synergistic effect, maximizing nutrient uptake efficiency and plant growth.
The contrasting responses between sole and intercropping highlight the importance of nutrient interactions and biological amendments in determining crop performance. Treatments such as T5 and T6 proved most effective for wheat under intercropping due to their ability to supply balanced nutrients and enhance microbial activity, thereby strengthening wheat’s competitive dominance. Conversely, treatments involving mycorrhiza (T4 and T7) were more beneficial for pea under sole-crop conditions, where the absence of competition allowed full expression of symbiotic advantages.
3.5. Effect of Ganga Sludge-based Organic Fertilizers on Growth Parameters of Pea and Wheat under sole and Intercropping Systems
The effect of Ganga sludge-based organic manures on yield attributes of pea and wheat under sole and intercropping systems is presented in Tables 7 and 8. The results clearly indicate that organic manure treatments, cropping patterns, and their interaction significantly influenced all studied parameters. Highly significant effects (p < 0.0001) were observed for most traits, demonstrating that both nutrient management and cropping system played a crucial role in determining crop performance.
| Factors | Pods/plant (Mix) | Pods/plant (Sole) | Pod wt./plant (Mix) | Pod wt./plant (Sole) | Yield (kg) Mix | Yield (kg) Sole |
|---|---|---|---|---|---|---|
| Treatments (T) | ||||||
| T0 | 6.22 ± 0.19ᵉ | 6.56 ± 0.02ʰ | 13.68 ± 0.96ᶠ | 23.69 ± 1.34ʰ | 1.69 ± 0.28ᶠ | 2.15 ± 0.53ᶠ |
| T1 | 7.56 ± 0.84ᶜ | 8.11 ± 0.48ᵍ | 21.14 ± 1.96ᵉ | 28.36 ± 0.97ᵍ | 2.39 ± 1.01ᵉ | 5.40 ± 0.29ᶜ |
| T2 | 7.11 ± 0.44ᵈ | 7.56 ± 1.17ᵍ | 25.92 ± 0.91ᵈ | 27.73 ± 1.53ᵍ | 3.13 ± 0.17ᵈ | 4.23 ± 0.41ᵉ |
| T3 | 7.44 ± 0.77ᶜᵈ | 9.67 ± 0.88ᶠ | 25.71 ± 0.89ᵈ | 32.81 ± 1.96ᵉ | 2.91 ± 0.10ᵈ | 5.30 ± 0.94ᶜ |
| T4 | 6.78 ± 0.51ᵉ | 9.89 ± 0.44ᶠ | 27.28 ± 1.14ᶜ | 35.86 ± 0.28ᵈ | 3.08 ± 0.13ᵈ | 5.37 ± 0.20ᶜ |
| T5 | 7.56 ± 0.19ᶜ | 10.67 ± 0.61ᵉ | 28.49 ± 3.36ᶜ | 31.65 ± 1.80ᵉ | 3.22 ± 0.38ᵈ | 5.27 ± 0.47ᶜ |
| T6 | 9.78 ± 0.69ᵃ | 12.54 ± 0.55ᵃ | 36.37 ± 2.41ᵃ | 41.12 ± 1.18ᵃ | 3.17 ± 0.66ᵈ | 6.69 ± 0.18ᵃ |
| T7 | 8.89 ± 1.07ᵇ | 11.44 ± 0.86ᵇ | 29.07 ± 3.84ᵇ | 36.37 ± 1.03ᶜ | 4.67 ± 0.27ᵃ | 6.81 ± 0.96ᵃ |
| Cropping Pattern (C) | ||||||
| Sole | - | 9.56 ± 0.70 | - | 32.20 ± 1.36 | 5.15 ± 0.57 | |
| Mix | 7.67 ± 0.66 | - | 25.96 ± 2.22 | - | 3.03 ± 0.50 | |
| LSD Value | 0.45 | 1.21 | 0.33 | |||
| CV (%) | 7.90% | 6.31% | 12.89% | |||
| T | *** | *** | *** | |||
| C | *** | *** | *** | |||
| T X C | *** | *** | *** | |||
| Factors |
100-seed wt (Sole) |
100-seed wt (Mix) | Spike length (Sole) | Spike length (Mix) | Seeds/spike (Sole) | Seeds/spike (Mix) | Yield (Sole) | Yield (Mix) |
|---|---|---|---|---|---|---|---|---|
| Treatments (T) | ||||||||
| T0 | 3.95 ± 0.02ᶜ | 3.48 ± 0.46ᵈ | 6.82 ± 0.70ᶜ | 7.59 ± 1.15ᶜ | 31.67 ± 3.38ᶜ | 32.78 ± 3.36ᶜ | 0.76 ± 0.03ᶜ | 0.780 ± 0.079ᵈ |
| T1 | 4.34 ± 0.18ᵃ | 4.26 ± 0.13ᵇ | 7.15 ± 0.39ᶜ | 7.71 ± 0.87ᶜ | 29.44 ± 4.35ᶜ | 35.89 ± 3.66ᵇ | 1.23 ± 0.02ᵇ | 0.835 ± 0.095ᶜ |
| T2 | 4.25 ± 0.31ᵃ | 4.28 ± 0.24ᵇ | 7.93 ± 0.19ᵇ | 8.14 ± 0.20ᵇ | 32.00 ± 4.33ᶜ | 37.11 ± 2.22ᵇ | 1.17 ± 0.04ᵇ | 0.853 ± 0.038ᶜ |
| T3 | 4.08 ± 0.30ᵇ | 4.16 ± 0.03ᵇ | 7.70 ± 0.88ᵇ | 8.26 ± 0.85ᵇ | 36.33 ± 5.51ᵇ | 41.11 ± 2.05ᵃ | 0.96 ± 0.03ᶜ | 0.793 ± 0.051ᵇ |
| T4 | 4.20 ± 0.24ᵇ | 4.47 ± 0.20ᵃ | 7.60 ± 0.38ᵇ | 8.59 ± 1.01ᵇ | 35.67 ± 3.53ᵇ | 38.22 ± 2.52ᵇ | 1.48 ± 0.02ᵃ | 0.868 ± 0.080ᵃ |
| T5 | 3.99 ± 0.07ᶜ | 4.50 ± 0.42ᵃ | 7.99 ± 0.26ᵇ | 8.92 ± 1.68ᵇ | 33.78 ± 6.17ᵇ | 39.11 ± 1.17ᵇ | 1.24 ± 0.02ᵇ | 0.795 ± 0.079ᶜ |
| T6 | 4.00 ± 0.11ᶜ | 4.60 ± 0.41ᵃ | 7.26 ± 1.01ᶜ | 9.57 ± 1.01ᵃ | 34.44 ± 5.43ᵇ | 38.00 ± 4.33ᵇ | 1.71 ± 0.04ᵃ | 1.000 ± 0.036ᵃ |
| T7 | 3.99 ± 0.21ᶜ | 4.63 ± 0.26ᵃ | 7.83 ± 0.51ᵇ | 9.24 ± 1.49ᵃ | 35.78 ± 4.62ᵇ | 39.44 ± 1.35ᵇ | 1.27 ± 0.03ᵇ | 0.956 ± 0.040ᶜ |
| Cropping Pattern (C) | ||||||||
| Sole | 4.10 ± 0.19 | 7.54 ± 0.61 | 33.64 ± 4.86 | 1.23 ± 0.03 | ||||
| Mix | 4.30 ± 0.31 | 8.50 ± 1.13 | 37.71 ± 2.73 | 0.86 ± 0.06 | ||||
| LSD Value | 0.24 | 0.83 | 3.62 | 0.05 | ||||
| CV (%) | 6.16% | 11.16% | 10.94% | 4.91% | ||||
| T | *** | *** | *** | *** | ||||
| C | *** | *** | *** | *** | ||||
| T X C | *** | * | ns | ** | ||||
A comparative assessment revealed that the magnitude and direction of response to cropping pattern varied distinctly between pea and wheat, indicating differential competitive and complementary interactions under intercropping conditions. In pea, the cropping pattern contributed the highest proportion of variation for yield parameters, particularly in number of pods per plant and yield per plot, reflecting strong sensitivity to interspecific competition. In contrast, wheat exhibited comparatively balanced contributions from treatments and cropping patterns, with treatment effects dominating yield variation, especially for yield per plot.
In pea, the sole cropping system consistently outperformed the intercropping system across all yield parameters, including number of pods per plant, pod weight per plant, and total yield. The mean values further confirmed a significant reduction in productivity under intercropping, which may be attributed to competition for light, nutrients, and space between pea and wheat plants. The interaction effect was also highly significant, suggesting that the response of pea to organic manure treatments varied under different cropping systems. Among treatments, T6 emerged as the most superior, recording the highest yield and forming a statistically distinct group, followed by T7, while the control (T0) consistently exhibited the lowest performance. The lower coefficient of variation indicated high experimental precision and reliability of the observed trends.
In contrast, wheat exhibited a reverse trend, where the intercropping system significantly enhanced yield attributes compared to sole cropping. Parameters such as spike length, number of seeds per spike, and yield per plot were higher under intercropping, suggesting a facilitative interaction between wheat and pea. This improvement may be attributed to the nitrogen-fixing ability of the pea, which likely enriched soil nitrogen availability, thereby benefiting wheat growth and grain development. Statistically, the analysis indicated significant differences in mean values between the sole and intercropping systems. The interaction effect was significant for most parameters, indicating that treatment efficacy was influenced by cropping pattern, although the interaction remained non-significant for the number of seeds per spike, suggesting a more stable response for this trait.
Across both crops, treatment T6 consistently demonstrated superior performance, indicating its effectiveness in improving nutrient availability, soil health, and plant productivity under both cropping systems. T7 also showed comparable performance, particularly in yield parameters, while lower treatments and control formed distinct, inferior statistical groups. The relatively low to moderate CV values across parameters further confirm the reliability of the experimental results, although higher variability in wheat yield suggests environmental or biological influences.
A clear contrast emerges when comparing the two crops: while pea productivity declines under intercropping due to competitive stress, wheat productivity improves due to complementary interactions, highlighting the asymmetric nature of intercropping systems. This indicates that wheat benefits from the presence of pea, whereas pea experiences resource limitation when grown together. Such findings emphasize the importance of optimizing crop combinations and nutrient management strategies to balance competition and facilitation in intercropping systems.
3.6. Relationship of Yield with Yield-contributing Traits under Sole and Intercropping Systems
The linear regression analysis across pea and wheat crops revealed significant variations in the strength of association between yield and its contributing traits under sole and intercropping systems. In pea (Fig. 4), both pods per plant and pod weight per plant exhibited positive and statistically significant relationships with yield under intercropping conditions, with moderate coefficients of determination (R2 = 0.2929 and 0.3604, respectively). This indicates that these traits contributed to yield variability to a limited extent under intercropping. However, under sole cropping, the relationships were much stronger, as reflected by high R2 values for pods per plant (0.6719) and pod weight per plant (0.6604), suggesting that these traits are major determinants of yield in sole cropping systems.
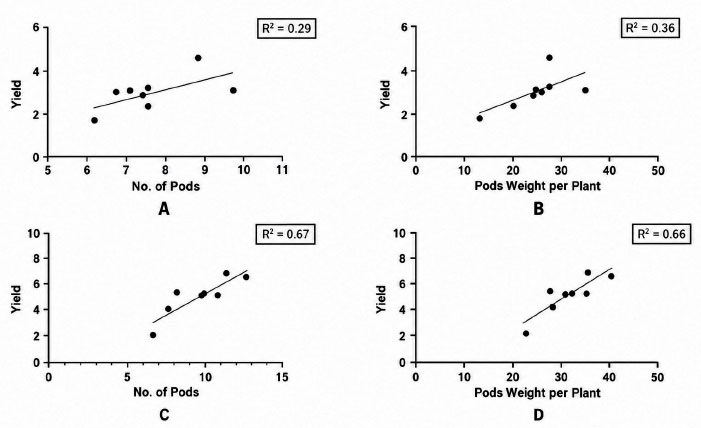
Linear regression relationships between yield and yield-attributing traits in pea under sole and intercropping systems: (A) pods per plant (intercropping), (B) pod weight per plant (intercropping), (C) pods per plant (sole), and (D) pod weight per plant (sole). Each point represents an individual observation (n = 72), and lines indicate fitted regression models.
In contrast, wheat showed comparatively weaker associations between yield and its contributing traits. Under sole cropping, the number of seeds per spike exhibited a weak but statistically significant relationship with yield (R2 = 0.06386), whereas spike length showed a non-significant and very weak association (R2 = 0.03924), indicating minimal influence on yield (Fig. 5). Under intercropping, both traits demonstrated improved relationships with yield, with number of seeds per spike (R2 = 0.08439) and spike length (R2 = 0.1438) showing statistically significant positive associations. Among these, spike length emerged as a relatively better predictor of yield under intercropping conditions in wheat.
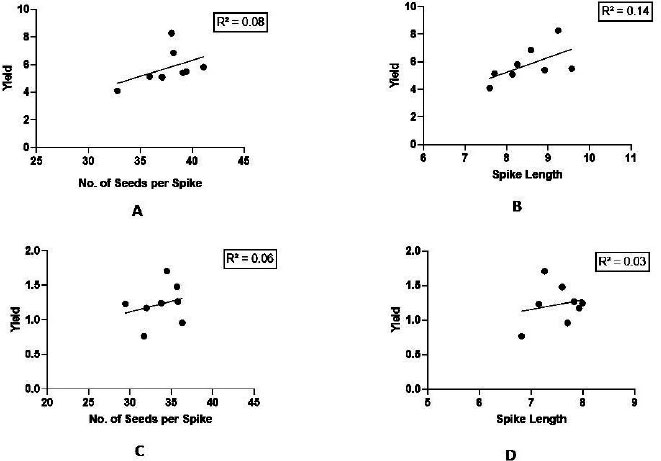
Linear regression relationships between yield and yield-attributing traits in wheat under sole and intercropping systems: (A) number of seeds per spike (intercropping), (B) spike length (intercropping), (C) number of seeds per spike (sole), and (D) spike length (sole). Each point represents an individual observation (n = 72), and lines indicate fitted regression models.
Overall, the comparative analysis indicates that yield in pea is more strongly influenced by its yield-attributing traits than in wheat, particularly under sole cropping conditions. While intercropping tends to reduce the strength of trait–yield relationships in pea, it slightly enhances the contribution of yield components in wheat. Nevertheless, the relatively low R2 values observed in wheat suggest that additional factors, including environmental conditions and management practices, play a substantial role in determining yield variability. The comparatively lower coefficients of determination observed in wheat suggest that grain yield under the wheat–pea intercropping system is governed by the integrated influence of several interacting factors rather than by any single yield component. Grain yield is a complex quantitative trait resulting from the combined effects of morphological attributes, physiological processes, nutrient dynamics, and interspecific interactions inherent to intercropping systems. Consequently, individual traits such as spike length and number of seeds per spike exhibited only modest independent contributions to total yield variation. Similar patterns have been reported in diversified cropping systems, where the cumulative effects of multiple factors often outweigh the influence of individual yield components. Therefore, the observed relationships highlight the complexity of yield formation in wheat and indicate that multivariate approaches, including multiple regression or path coefficient analysis, may further elucidate the combined contributions of various yield-determining factors.
3.7. Land Equivalent Ratio (LER)
The intercropping advantage, as reflected by the Land Equivalent Ratio (LER), varied markedly among treatments (Fig. 6). In all treatments, the LER exceeded unity, demonstrating a clear advantage of wheat-pea intercropping over the corresponding sole cropping systems in terms of land-use efficiency. The highest total LER was recorded under T0 (2.32), followed by T2 (1.83) and T7 (1.82), indicating greater complementarity and more efficient utilization of available resources under these treatments. Conversely, the lowest LER was observed in T6 (1.35), although the value remained above unity, confirming the overall superiority of the intercropping system.
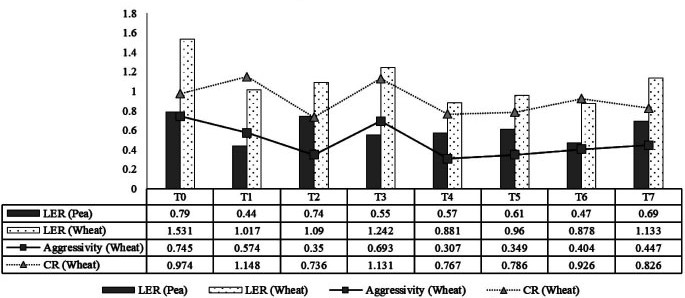
Competition indices in wheat–pea intercropping system under different Ganga sludge-based organic manure treatments.
The partial LER of pea ranged from 0.44 to 0.79, whereas that of wheat varied between 0.88 and 1.53 (Fig. 6). The highest partial LER for pea was observed in T0 (0.79), followed by T2 (0.74) and T7 (0.69), suggesting better adaptation and productivity of pea under these treatments. In contrast, the lowest pea LER was recorded in T1 (0.44). Wheat exhibited comparatively higher partial LER values than pea in most treatments, with the maximum value recorded under T0 (1.53), followed by T3 (1.24) and T7 (1.13). The lowest wheat LER values were observed under T6 (0.88) and T4 (0.88). The relatively higher contribution of wheat to the total LER indicates that wheat played a major role in enhancing overall system productivity, although both crops contributed positively to the intercropping advantage.
The Aggressivity index of wheat remained positive across all treatments, ranging from 0.307 to 0.745, indicating that wheat was consistently the dominant species in the wheat–pea intercropping system. The highest aggressivity value was recorded under T0 (0.745), followed by T3 (0.693) and T1 (0.574), suggesting a relatively greater competitive advantage of wheat under these treatments. The lowest aggressivity value was observed in T4 (0.307), indicating a more balanced competitive interaction between the component crops.
Similarly, the Competitive Ratio (CR) of wheat varied from 0.736 to 1.148. The highest CR was recorded under T1 (1.148), followed by T3 (1.131), indicating greater competitive ability of wheat relative to pea under these nutrient regimes. In contrast, the lowest CR values were observed in T2 (0.736) and T4 (0.767), reflecting comparatively balanced competition between the two species. Overall, the competition indices revealed that although wheat maintained a slight to moderate dominance over pea in all treatments, the intercropping advantage was primarily associated with complementary resource utilization and balanced interspecific interactions rather than strong competitive suppression of the companion crop.
3.8. Correlation Analysis of Soil Properties and Growth/Yield Parameters in Wheat and Pea
Pearson’s correlation analysis presented in Fig. (7) reveals distinct yet consistent relationships between soil chemical properties, plant growth attributes, and yield parameters in both wheat and pea under sole and intercropping systems. Overall, the results indicate that nutrient availability, rather than total nutrient content, plays a decisive role in determining crop performance.
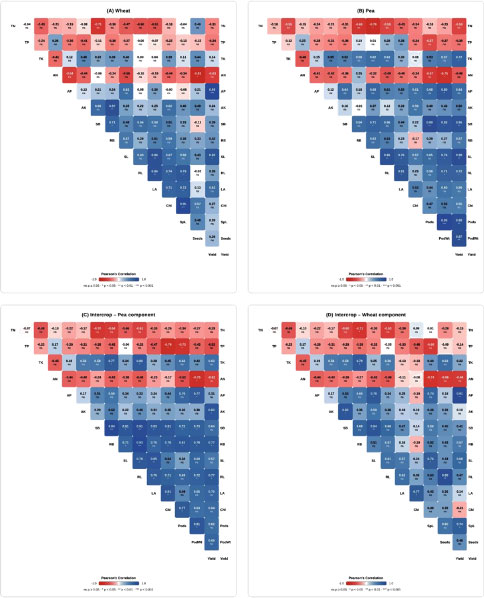
Pearson’s correlation analysis depicting the relationships between soil chemical properties and growth and yield parameters of wheat and pea under (A) sole wheat, (B) sole pea, (C) intercropped pea component, and (D) intercropped wheat component. Color intensity indicates the strength and direction of correlation (blue = positive, red = negative), with significance levels denoted as * (p < 0.05), ** (p < 0.01), and *** (p < 0.001). TN: Total Nitrogen, TP: Total Phosphorus, TK: Total Potassium, AN: Available Nitrogen, AP: Available Phosphorus, AK: Available Potassium, SB: Shoot Biomass, RB: Root Biomass, SL: Shoot Length, RL: Root Length, LA: Leaf Area, Chl: Chlorophyll content, SpL: Spike Length (wheat), Seeds: Seeds per spike (wheat), Pods: Pods per plant (pea), Pod wt.: Pod weight per plant (pea), Yield: Grain/seed yield.
In both crops, Available Phosphorus (AP) exhibited a strong positive correlation with chlorophyll content and yield (including pods and pod weight in pea), highlighting its key role in photosynthesis, reproductive development, and, in legumes, biological nitrogen fixation under a sole cropping system (Fig. 7A and 7B). Similarly, Available Potassium (AK) showed moderate to strong positive associations with growth parameters such as Shoot Biomass (SB), Root Biomass (RB), Shoot Length (SL), Root Length (RL), and Leaf Area (LA), reflecting its contribution to overall plant vigor and assimilate translocation. In contrast, Available Nitrogen (AN) demonstrated negative correlations with several growth and yield traits in both wheat and pea, suggesting that excess nitrogen may favor vegetative growth over reproductive output and, in legumes, suppress symbiotic nitrogen fixation. Furthermore, total nutrients (TN, TP, TK) generally exhibited weak or negative correlations with most parameters, emphasizing their limited direct relevance compared to available nutrient forms. Additionally, growth traits such as SL, RL, LA, and chlorophyll were strongly intercorrelated in both crops, indicating coordinated plant development that ultimately contributes to improved yield.
Under the intercropping system (Fig. 7C and D), both pea and wheat components exhibited stronger and more consistent positive correlations among growth parameters and yield traits compared to sole cropping, indicating enhanced resource-use efficiency. Traits such as Shoot Biomass (SB), Root Biomass (RB), Shoot Length (SL), Root Length (RL), and Leaf Area (LA) were strongly interrelated and positively associated with yield in both crops. Available Potassium (AK) showed a notably strong positive correlation with yield, while Available Phosphorus (AP) also emerged as a key contributor, particularly in the wheat component, reflecting improved nutrient uptake and physiological performance under intercropping. In contrast, Available Nitrogen (AN) maintained negative correlations with most growth and yield parameters, consistent with sole systems. Total nutrients (TN and TP) continued to show weak or negative associations, reinforcing their limited role compared to available forms. Overall, growth parameters were positively associated with yield across all systems, with stronger relationships in pea than in wheat. Intercropping enhanced these positive interactions, suggesting improved nutrient utilization and system productivity, particularly driven by available phosphorus and potassium.
4. DISCUSSION
The present investigation clearly demonstrates that Ganga sludge-based organic fertilizers significantly improved soil fertility, crop growth, and productivity under both sole and wheat-pea intercropping systems. The enhancement in plant performance was primarily associated with increased availability of key nutrients, particularly Phosphorus (AP) and Potassium (AK), rather than changes in total nutrient pools, indicating the dominant role of bioavailable fractions in regulating crop productivity.
The significant rise in available phosphorus under treatments T4 (Jaivik Poshak), T6 (Jaivik Prom + Jaivik Khad), and T7 (Pori Potash + Jaivik Poshak) highlights the importance of biological and organic inputs in improving P dynamics. Organic amendments release organic acids during decomposition, which reduce P fixation and enhance solubilization, while arbuscular mycorrhizal fungi extend the root absorption zone and facilitate efficient P uptake [25]. Recent studies further confirm that integrated organic nutrient management enhances phosphorus availability through microbial mediation and synergistic interactions [26-28]. The strong positive correlation observed between AP and growth/yield parameters in both crops reflects the central role of phosphorus in ATP synthesis, energy transfer, nucleic acid formation, and root development. In legumes such as pea, adequate P is particularly critical for nodulation and biological nitrogen fixation, thereby directly influencing reproductive development and yield [29-32].
Similarly, the higher available potassium observed in T7 can be attributed to both direct K inputs and enhanced microbial solubilization. Organic matter improves soil cation exchange capacity, reducing K losses, while potassium-solubilizing microorganisms mobilize non-exchangeable K through organic acid production and mineral weathering [33, 34]. The strong association between AK and growth traits such as root biomass, chlorophyll content, and yield is consistent with the role of potassium in enzyme activation, osmoregulation, stomatal function, and assimilate translocation [35-39].
In contrast, total nutrient fractions (TN, TP, TK) remained relatively unchanged across treatments, suggesting that organic fertilizers primarily influence labile nutrient pools in the short term. This aligns with the slow mineralization pattern of organic inputs and supports the concept that nutrient availability, rather than total nutrient content, governs plant nutrition and productivity [40-42]. The strong correlations observed between available nutrients (AN, AP, AK) and growth/yield parameters further confirm that plant performance is driven by nutrient intensity (available fraction) rather than quantity (total pool), as emphasized by Fageria et al. [43].
The relatively weak or non-significant variation in available nitrogen across treatments may be due to slow mineralization and environmental dependence of organic N release [44]. However, higher AN in pea-based systems reflects the contribution of biological nitrogen fixation through symbiosis with Rhizobium leguminosarum, enriching soil nitrogen pools [45-48]. The comparatively weaker or negative correlation of AN with yield, particularly in pea, may be explained by excessive nitrogen promoting vegetative growth at the expense of reproductive development and suppressing nodulation and N2 fixation [49, 50].
The superior growth performance observed under treatments T5, T6, and T7, reflected in higher biomass, leaf area, and chlorophyll content, can be attributed to improved nutrient supply, enhanced microbial activity, and better soil physical properties. Organic amendments promote soil aggregation, water retention, and root proliferation, thereby enhancing nutrient uptake and photosynthetic efficiency [51-54]. The strong interrelationships among growth traits (shoot length, root length, leaf area, and biomass) indicate coordinated plant development under improved nutrient availability, ultimately leading to enhanced productivity [55].
Cropping system effects revealed that pea performed better under sole cropping, whereas wheat benefited more under intercropping. The reduced performance of pea in intercropping systems is attributed to interspecific competition, while wheat gains from complementary interactions and nitrogen facilitation from the legume component. Such cereal–legume complementarities enhance nutrient-use efficiency and system productivity [56-58].
Yield responses further support these findings. In pea, yield was strongly governed by reproductive traits such as pods per plant and pod weight, particularly under sole cropping, indicating the dominance of sink strength and assimilate partitioning in determining productivity [59, 60]. Under intercropping, these relationships weakened due to competitive interactions, consistent with earlier reports [61, 62]. In contrast, wheat showed weaker associations between yield and individual traits, reflecting its complex yield formation involving multiple physiological processes [63]. Slight improvement in trait–yield relationships under intercropping suggests better resource sharing and altered plant architecture [64].
The Land Equivalent Ratio (LER > 1) across all treatments confirms the agronomic advantage of wheat–pea intercropping in terms of land-use efficiency and resource utilization. The highest total LER was recorded in T2 and T7, indicating greater complementarity and more efficient exploitation of available resources under these treatments. The superior land-use efficiency observed in the wheat–pea intercropping system can be attributed to ecological complementarity between the component crops. Cereals and legumes differ markedly in their patterns of resource acquisition, rooting characteristics, canopy architecture, and nutrient requirements, enabling them to utilize environmental resources more efficiently when grown together than in monoculture. In particular, the ability of peas to fix atmospheric nitrogen through symbiotic association with rhizobia can enhance nitrogen availability in the rhizosphere and partially benefit the associated wheat crop, thereby improving overall system productivity. Moreover, differences in rooting depth and temporal patterns of nutrient uptake reduce direct interspecific competition and promote niche differentiation, resulting in improved resource capture and biomass production. Similar mechanisms have been widely reported in cereal–legume intercropping systems, where increased productivity and land-use efficiency are primarily associated with facilitative interactions and complementary resource utilization rather than competitive exclusion [61, 65-69]. The comparatively greater contribution of wheat to the total LER and its consistently positive aggressivity values further suggest that wheat derived substantial benefits from these complementary interactions while maintaining only moderate competitive dominance over pea. Similarly, the higher crop growth rates observed in wheat under intercropping and in pea under sole cropping reflect species-specific responses to interspecific competition and nutrient dynamics, likely mediated by improved nutrient availability and enhanced microbial activity in the rhizosphere [70, 71].
Overall, the study establishes that the integrated application of Ganga sludge-based organic fertilizers, particularly T5, T6, and T7, effectively enhances soil nutrient availability, plant growth, and productivity. The findings further emphasize that nutrient bioavailability, microbial interactions, and cropping system design collectively determine crop performance. The combination of organic nutrient management with cereal-legume intercropping emerges as a sustainable strategy for improving soil health, optimizing nutrient cycling, and enhancing agricultural productivity under diverse agro-ecological conditions.
CONCLUSION
Today, farmers are increasingly seeking sustainable alternatives to chemical fertilizers to enhance crop productivity while improving soil health and reducing environmental impact. The objective of this study was to evaluate the effects of different Ganga sludge-based organic fertilizers, applied singly or in combination, on soil chemical properties, growth parameters, yield attributes, and land-use efficiency of wheat (Triticum aestivum), pea (Pisum sativum), and their intercropping system. The results demonstrated a significant positive influence of the organic fertilizer treatments on soil available phosphorus and potassium, plant growth, and yield parameters across all cropping systems. In general, combined applications produced the most favorable outcomes. Treatments T5 (Jaivik Khad), T6 (Jaivik Prom + Jaivik Khad), and T7 (Pori Potash + Jaivik Poshak) consistently showed superior performance in enhancing nutrient availability, biomass accumulation, chlorophyll content, and final yield.
The study clearly revealed contrasting responses between the two crops under different cropping systems. Pea performed better under sole cropping due to reduced interspecific competition, whereas wheat exhibited enhanced growth and yield under intercropping with pea, benefiting from complementary interactions and biological nitrogen fixation by the legume. Although pea experienced competitive suppression in the intercropping system, the Land Equivalent Ratio (LER) values were substantially greater than unity, confirming the higher resource-use efficiency of the wheat–pea intercropping system. Overall, the integrated use of Ganga sludge-based organic fertilizers, especially T6 and T7, offers a sustainable approach for nutrient recycling, soil fertility improvement, and enhanced productivity in organic farming systems. The present study strongly supports the adoption of Ganga sludge-based organic nutrient management combined with cereal-legume intercropping as a viable strategy for improving soil health, resource-use efficiency, and agricultural productivity in organic and low-input farming systems.
The present study covers only a limited number of seasons, which requires further long-term multi-seasonal exploration. The lasting impact of Ganga sludge-based organic manures on all agricultural and horticultural crops has not been fully examined, which requires further experimentation. The field trials in different agro-ecological zones are also required to fully understand the variation in the performance of Ganga sludge-based organic amendments. Microbial community analysis and direct measurements of actual nitrogen fixation should also be performed in further studies. Further long-term field studies are recommended to evaluate the residual effects, heavy metal dynamics, and scalability of these organic fertilizers under diverse agro-ecological conditions.
AUTHORS’ CONTRIBUTIONS
The authors confirm their contributions to the paper as follows: A.B.: Study conception and design; V.K.: Conceptualized the study; A.G. and N.S.: Collected data; V.A.: Analysis and interpretation of results; DrafETHICSted the manuscript; Methodological validation and manuscript review. All authors reviewed the results and approved the final version of the manuscript.
LIST OF ABBREVIATIONS
| ANOVA | = Analysis of Variance |
| CV (%) | = Coefficient of Variation (Percentage) |
| DAS | = Days After Sowing |
| LSD | = Least Significant Difference |
| RBD | = Randomized Block Design |
| SD / STDEV | = Standard Deviation |
| AK | = Available Potassium |
| AN | = Available Nitrogen |
| AP | = Available Phosphorus |
| OC | = Soil Organic Carbon |
| TK | = Total Potassium |
| TN | = Total Nitrogen |
| TP | = Total Phosphorus |
| CGR | = Crop Growth Rate |
| CHL / Chl | = Chlorophyll / Chlorophyll content |
| CR | = Competitive Ratio |
| LA | = Leaf Area |
| LER | = Land Equivalent Ratio |
| RB | = Root Biomass |
| RL | = Root Length |
| SB | = Shoot Biomass |
| SC | = Sole Cropping |
| SL | = Shoot Length |
| SpL | = Spike Length |
| FCO | = Fertilizer Control Order |
| ICAR | = Indian Council of Agricultural Research |
| NABL | = National Accreditation Board for Testing and Calibration Laboratories |
| PORI | = Patanjali Organic Research Institute |
| PRF | = Patanjali Research Foundation |
| STP | = Sludge Treatment Plant |
AVAILABILITY OF DATA AND MATERIALS
All data generated or analyzed during this study are included in this published article.
ACKNOWLEDGEMENTS
The authors express their sincere gratitude to Revered S R J for his constant inspiration, unwavering support, and invaluable guidance throughout the study. The authors are also deeply thankful to the Patanjali Herbal Research Department and the Patanjali Research Institute, Haridwar, India, for providing the necessary research facilities, technical support, and comprehensive assistance that made this work possible. Special thanks are extended to PORI for providing the test fertilizers used in this experiment. This work would not have been possible without their kind cooperation and support.