All published articles of this journal are available on ScienceDirect.

Soil Microsclerotial Density Is Strongly Associated with Olive Wilt Severity in Tunisian Orchards

Abstract
Introduction/Objective
Verticillium wilt, caused by Verticillium dahliae, is a persistent soilborne constraint to Mediterranean olive production. This cross-sectional study evaluated the association between culturable soil microsclerotial density and ordinal wilt stage across five Tunisian orchards and separately documented the analytical provenance of an IGS-targeted SYBR Green qPCR assay.
Methods
The retained dataset comprised one orchard-stage composite soil unit for each of four symptom stages in each orchard (20 units), with three technical plate counts per unit. Archived records do not preserve tree/core-level sampling metadata, which were not imputed. Stage effects were tested with orchard as a block, and an orchard-fixed-effects regression, cluster bootstrap, and influence analyses quantified the ordered trend and robustness. qPCR summaries were treated as ancillary assay information rather than field inoculum measurements.
Results
Mean inoculum increased from 8.4 MS/g at the asymptomatic stage to 168.8 MS/g at the severe/dead stage. The orchard-blocked stage effect was strong (F(3,12) = 79.98, P < 0.0001; partial η2 = 0.952), and the adjusted trend was 0.421 log10 units per stage (95% CI, 0.351-0.491; R2 = 0.922). Excluding the BH stage-3 value produced a similar slope (0.405; 95% CI, 0.331-0.478).
Discussion
The association was robust within this dataset, but the cross-sectional design and incomplete archived field-sampling metadata preclude causal or predictive interpretation. Observed stage-specific ranges are descriptive rather than validated thresholds.
Conclusion
Soil microsclerotial density was a strong local correlate of olive wilt stage. Predictive thresholds require prospective, independently replicated and spatially standardized validation.
1. INTRODUCTION
Olive (Olea europaea L.) is a major perennial crop of the Mediterranean Basin, and Verticillium wilt caused by Verticillium dahliae Kleb. is among its most persistent soilborne diseases. The pathogen has been documented in Tunisian olive orchards, including defoliating pathotypes and genetically diverse populations, and can cause chlorosis, wilt, defoliation, branch dieback, progressive canopy decline, and tree death [1-3]. Because systemic infections are difficult to cure, management emphasizes prevention, healthy planting material, inoculum reduction, sanitation, irrigation and soil management, and host resistance [4].
The epidemiological persistence of Verticillium wilt is closely linked to melanized microsclerotia, which can survive in soil and infected residues for extended periods and germinate in response to root-associated signals. After root infection, V. dahliae colonizes xylem tissues, where pathogen growth and host vascular responses contribute to wilt expression [5-7]. Soil inoculum density is therefore biologically relevant, but the density measured near a diseased tree may reflect both pre-existing infection pressure and microsclerotia returned to soil from infected roots and residues.
Experimental studies have demonstrated inoculum-density effects on Verticillium wilt, including olive, but the numerical relationship varies with host susceptibility, isolate aggressiveness, soil environment, and assay methodology [8]. Conventional microsclerotial assays are sensitive to soil preparation, sieving, selective medium, incubation, recovery efficiency, and spatial aggregation of propagules [9-12]. These sources of variability make field counts useful as sample-based estimates while arguing against universal numerical thresholds derived from a single site or sampling design.
Pathotype, host genotype, and production environment further modify disease expression. Olive cultivars differ in susceptibility, populations of V. dahliae differ in pathogenic and genetic characteristics, and environmental drivers such as temperature and water availability influence disease occurrence and expression [13-18]. Consequently, equivalent soil inoculum densities may not produce equivalent disease outcomes across orchards, cultivars, pathogen populations, or seasons.
Molecular diagnostics provide complementary approaches to culture-based enumeration. Quantitative PCR assays have been developed for V. dahliae in soil, and newer platforms include droplet digital PCR, loop-mediated isothermal amplification, and CRISPR-associated detection [19-25]. However, analytical performance with purified or plasmid standards does not by itself demonstrate quantitative performance in orchard soil, where extraction recovery, inhibitors, target copy number, and DNA from nonviable material can affect interpretation. Current MIQE guidance therefore supports explicit separation of analytical calibration from biological quantification [26, 27].
For field epidemiology, this distinction is coupled with a second design issue: observations collected at several disease stages within the same orchard are clustered rather than fully independent. Analyses should therefore account for orchard-level dependence, and any proposed inoculum boundaries derived from the same cross-sectional dataset should be described as observed ranges rather than validated predictors. Prospective validation is particularly important in perennial systems, where disease stage, local inoculum accumulation, and management history can evolve over multiple seasons [4, 12].
Independent Mediterranean and comparative Verticillium studies reinforce the context dependence of field inoculum interpretation. Regional occurrence, pathogen biology, conventional soil-assay performance, crop sequence and irrigation, within-orchard spread, and host/pathotype responses all modify the relationship between recoverable microsclerotia and disease expression [28-36]. These findings support treating a field MS/g value as a design- and host-dependent estimate rather than a transferable biological threshold.
Diagnostic development has progressed from ribosomal-intergenic and sequence-characterized PCR markers to matrix-oriented real-time PCR approaches, while soilborne-disease management research continues to emphasize assay recovery and environmental context [37-41]. Quantitative interpretation also depends on defensible amplification-efficiency estimation and model assumptions [42, 43]. These methodological considerations are directly relevant to the restricted qPCR interpretation adopted here.
The present study addressed these issues in a Tunisian orchard dataset with four objectives: (i) to quantify the association between conventional soil microsclerotial density and an ordinal olive wilt stage across five orchards; (ii) to analyze orchard-stage means while explicitly accounting for orchard-level clustering and avoiding pseudoreplication of technical plate counts; (iii) to evaluate the robustness and uncertainty of the stage-inoculum association, including sensitivity to the high BH stage-3 value; and (iv) to report the available IGS-targeted SYBR Green qPCR standard-curve information as ancillary analytical evidence without treating it as an independent field-soil dataset.
2. MATERIALS AND METHODS
2.1. Study Design, Orchard Metadata, and Disease Classification
Five olive orchards, coded BH, TG, ZR1, ZR2, and ZR3, were represented in the archived survey dataset. The retained orchard metadata comprised previous crops, irrigation system, tree age, total number of trees, and number of diseased trees; disease incidence was calculated as 100 × diseased trees/total trees. Incidence was 18.0% for BH, 5.0% for TG, 23.5% for ZR1, 10.0% for ZR2, and 7.0% for ZR3. All orchards had a recorded history of potato cultivation, and BH and ZR2 also had melon. Because no orchard without previous potato cultivation was represented, crop-history effects were treated descriptively rather than causally.
The orchard-level metadata retained in the archived survey are reported in full in Table 1 and comprise previous crops, irrigation system, tree age, total number of trees, number of diseased trees, and calculated disease incidence. Trees were assigned cross-sectionally to four ordinal symptom stages: stage 0, asymptomatic; stage 1, mild; stage 2, moderate; and stage 3, severe/dead. The four stages were not repeated measurements of the same trees through time. The lowest documented field unit in the retained dataset was one orchard-stage composite soil unit, yielding 20 orchard-stage units nested within five orchards. The archived field record did not preserve tree identifiers, the number of trees or independent soil cores contributing to each composite, the spatial arrangement of cores, exact sampling depth or distance from the trunk, rhizosphere-versus-bulk-soil designation, sampling date/season, tree-selection details beyond symptom-stage assignment, or pre-analytical storage conditions. These attributes cannot be reconstructed retrospectively and were not imputed. Accordingly, tree-level and core-level variance cannot be estimated, and inference is restricted to the documented orchard-stage composite units.
| Orchard | Previous Crops | Irrigation | Tree Age (years) | Total Trees | Diseased Trees | Incidence (%) |
|---|---|---|---|---|---|---|
| BH | Potato + melon | Drip | 25 | 300 | 54 | 18.00 |
| TG | Potato | Drip | 8 | 400 | 20 | 5.00 |
| ZR1 | Potato | Drip | 10 | 200 | 47 | 23.50 |
| ZR2 | Potato + melon | Basin | 30 | 100 | 10 | 10.00 |
| ZR3 | Potato | Basin | 25 | 100 | 7 | 7.00 |
2.1.1. Prospective Standardized Sampling Framework (Not Applied to the Archived Survey)
Because the missing historical sampling metadata cannot be recovered, no numerical field-sampling details were assigned retrospectively. Supplementary Table S1 therefore provides a prospective framework only. The proposed design retains at least five independently sampled trees per symptom category per orchard; 12 cores per tree collected in four cardinal directions at 25, 50, and 100 cm from the trunk; a recorded 0-30-cm profile (preferably retained as 0-15 and 15-30 cm strata); separate bulk/core and root-adherent rhizosphere matrices; spring and autumn sampling; tree-level compositing; a 100-gram air-dried analytical subsample; cold dark storage; and processing within 4-6 weeks. The prospective quality-control checklist additionally specifies field blanks, tool decontamination, location and soil-condition records, positive and negative laboratory controls, replicate-agreement checks, and blinded recounts. None of these prospective specifications or illustrative quality-control expectations is presented as a reconstruction of the archived survey.
2.2. Conventional Quantification of Soil Microsclerotia
Microsclerotia were quantified by the wet-sieving and Ethanol Potassium Amoxicillin Agar (EPAA) plating procedure used for soil enumeration of V. dahliae [11, 21]. In the laboratory protocol, 10 grams of air-dried soil were suspended in 100 mL of 2% sterile water agar and agitated for 2 hours at 220 rpm. The suspension was passed through nested 200-µm and 20-µm sieves; the fraction retained on the 20-µm sieve was recovered and resuspended in 100 mL sterile distilled water. Aliquots of 1 mL were distributed onto EPAA plates. Per liter, EPAA contained 2 mL of ethanol (Bio Basic Inc., Canada; Cat. No. D0193), 1.5 g of potassium dihydrogen phosphate (KH2PO4; Bio Basic Inc., Canada; Cat. No. PB0445), 4 g of dipotassium hydrogen phosphate (K2HPO4; Bio Basic Inc., Canada; Cat. No. PB0447), 50 mg of amoxicillin (Sigma-Aldrich, USA; Cat. No. A8523), and 15 g of bacteriological agar (Sigma-Aldrich, USA; Cat. No. A5306) [11]. Plates were incubated in darkness at 22°C for 15 days, gently washed to improve visualization, and incubated for a further 15 days. Germinated microsclerotial colonies with the characteristic V. dahliae morphology were counted under a stereomicroscope and expressed as microsclerotia per gram of soil (MS/g). The procedure estimates culturable propagules recovered under the assay conditions rather than total pathogen DNA or all viable propagules present in the original soil [9-11, 21].
Three retained plate counts were available for every orchard-stage unit and represented repeated technical determinations of the same composite soil preparation. They were summarized as an orchard-stage mean and technical standard error and were not treated as independent biological replicates. The retained record does not include separate positive/negative control results or blinded recount data; therefore, the quality assurance that can be documented for this dataset is limited to technical triplication and morphological counting of germinated microsclerotia. No additional independent field replicate can be inferred from the plate number. Replicate-level counts are provided in Supplementary Table S2, orchard-stage summaries and metadata in Supplementary Table S3, and technical replicate dispersion in Supplementary Fig. S1.
2.3. qPCR Analytical Performance and Reporting Limits
The ancillary molecular dataset concerned a SYBR Green qPCR assay targeting the ribosomal Intergenic Spacer (IGS) region [21]. Directly available summary information comprised the nominal plasmid dilution levels from 5 × 10^6 to 5 copies/µL, summarized Cycle-threshold (Ct) values and dispersion for the inter-assay and intra-assay dilution series, and an IGS copy-number calibration summary relative to beta-tubulin. Individual well-level Ct measurements and raw Ct values for the orchard soil samples were not available. Using the retained information, mean Ct summaries were regressed against log10 nominal copy number to reconstruct the slope, intercept, and coefficient of determination (R2); amplification efficiency was then calculated as E = [10^(-1/slope) - 1] × 100. The isolate-level IGS calibration summaries are provided in Supplementary Table S4. Reporting follows MIQE principles, which require analytical calibration to be distinguished from biological quantification [26, 27].
Assay provenance and prior publication: the IGS-targeted SYBR Green platform was originally developed and validated by Gharbi et al. [21]. That publication included a five-soil field comparison between qPCR, disease severity, and conventional plating. Those previously published field qPCR comparisons are not presented here as new results and are not reanalyzed. The primary inferential dataset in the present article is the retained 20-cell orchard-stage plating dataset. Because the archived records available in the study archive do not contain sample-level identifiers sufficient to link the present orchard-stage composites to the five field soils used in the 2016 qPCR comparison, sample-level independence cannot be established retrospectively. Accordingly, the qPCR material retained here serves only to document assay provenance and a summary of analytical calibration, not to provide independent confirmation of the field association.
A positive signal at 5 copies/µL was retained only as the lowest summarized analytical detection point under the plasmid-standard conditions. A conservative 50-copy/µL quantification level was used because summarized coefficients of variation remained below 1% at and above this level but increased at 5 copies/µL. These designations are not validated soil-matrix limits of detection or quantification. They do not account for DNA extraction recovery, adsorption, soil inhibitors, microsclerotial DNA content, or spatial heterogeneity of inoculum.
Because matched field-soil Ct measurements were unavailable, the study does not report a qPCR-versus-plating correlation, agreement analysis, diagnostic sensitivity or specificity in orchard soil, or conversion of qPCR copy number to MS/g. Such analyses require measurements from the same soil aliquots along with extraction controls, inhibition assessments, recovery experiments, and matrix-specific calibration. The qPCR component is therefore presented only as an analytical description of the summarized standard-curve dataset and does not contribute independent evidence to the field association tested in this study.
2.4. Statistical Analysis
For each orchard-stage unit, the biological observation used in analysis was the mean of its three technical plate counts. The outcome was transformed as log10(mean MS/g + 1) to reduce right skew and accommodate low values. Because each orchard contributed one observation at each of the four cross-sectional stages, the categorical stage effect was tested with an additive orchard-blocked model, log10(MS/g + 1) = μ + orchard + stage + error, which is equivalent to a randomized complete block analysis. This use of orchard as a block does not imply that the same trees were followed through stages. The stage effect was summarized by F(3,12), its P-value, and partial η2. A Friedman test with orchard as the block provided a rank-based confirmation.
Pairwise stage comparisons were performed with paired t-tests on transformed orchard-stage means and Holm adjustment; the complete contrasts are reported in Supplementary Table S5. To quantify the ordered trend while accounting for clustering, stage (0-3) was entered as a numeric predictor in a linear model with orchard fixed intercepts. The stage coefficient (β), 95% Confidence Interval (CI), model R2, and corresponding multiplicative change 10^β in MS/g + 1 were reported. Uncertainty was additionally evaluated by a 10,000-resample cluster bootstrap in which orchards, rather than individual cells, were resampled. Spearman's ρ across the 20 cells was retained as a descriptive monotonic index; its independence-based P value was not used for inference. Robustness was assessed by (i) excluding the influential BH stage-3 value and refitting the trend and descriptive correlation and (ii) repeating the fixed-effects trend while omitting each orchard in turn. These cluster-aware and sensitivity results are summarized in Supplementary Table S6. Tests were two-sided. Orchard-level incidence analyses were treated as descriptive because n=5 and orchard characteristics were confounded with orchard identity.
3. RESULTS
3.1. Orchard Context and Disease Incidence
The orchard metadata are presented in Table 1 and Supplementary Table S3. Disease incidence ranged from 5.0% to 23.5%. ZR1 had the highest incidence (47/200 trees; 23.5%), followed by BH (54/300; 18.0%), ZR2 (10/100; 10.0%), ZR3 (7/100; 7.0%), and TG (20/400; 5.0%). Tree age ranged from 8 to 30 years. BH, TG, and ZR1 used drip irrigation, whereas ZR2 and ZR3 used basin irrigation. In Fig. (1A), these incidences are shown by orchard; (Fig. 1B) displays the descriptive relationship of tree age, incidence, irrigation category, and orchard size; and (Fig. 1C) shows the 20 orchard-stage microsclerotial means. The exploratory orchard-level relationship between disease incidence and mean inoculum across stages is shown separately in Supplementary Fig. S2. Because orchard characteristics were not independently replicated, these displays are contextual and do not estimate causal effects of age, irrigation, orchard size, previous crop, or mean inoculum on orchard-level incidence.
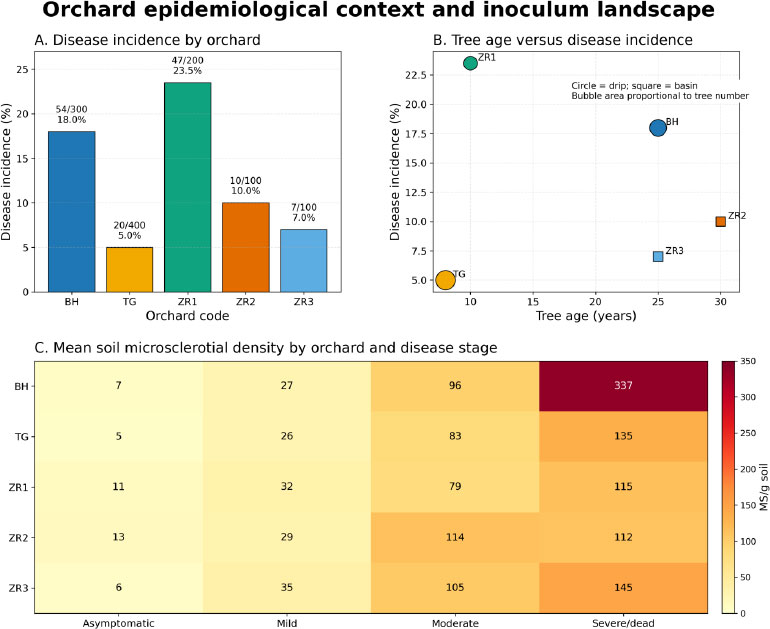
Orchard epidemiological context and inoculum landscape. (A) Disease incidence (%) by orchard; labels indicate diseased/total trees. (B) Descriptive relationship between tree age and disease incidence; circle = drip irrigation, square = basin irrigation, and bubble area is proportional to total tree number. (C) Heatmap of mean soil Microsclerotial density (MS/g) by orchard and disease stage: 0, asymptomatic; 1, mild; 2, moderate; and 3, severe/dead. All panels present descriptive orchard-level or orchard-stage summaries.
3.2. Soil Microsclerotial Density Increased with Symptom Stage
Mean microsclerotial density increased across the four symptom stages (Table 2; Supplementary Tables S2-S3). The orchard-stage mean was 8.4 ± 1.5 MS/g for stage 0 (asymptomatic), 29.8 ± 1.7 MS/g for stage 1 (mild), 95.4 ± 6.6 MS/g for stage 2 (moderate), and 168.8 ± 42.5 MS/g for stage 3 (severe/dead). The highest orchard-stage mean occurred in BH at stage 3 (337 MS/g); the three technical counts for this composite ranged from 302 to 366 MS/g. The dispersion of all technical plate replicates is shown in Supplementary Fig. S1.
| Stage | Descriptor | n Orchards | Mean MS/g | SE | Median | Minimum | Maximum | Group |
|---|---|---|---|---|---|---|---|---|
| 0 | Asymptomatic | 5 | 8.40 | 1.54 | 7.00 | 5.00 | 13.00 | a |
| 1 | Mild | 5 | 29.80 | 1.66 | 29.00 | 26.00 | 35.00 | b |
| 2 | Moderate | 5 | 95.40 | 6.56 | 96.00 | 79.00 | 114.00 | c |
| 3 | Severe/dead | 5 | 168.80 | 42.50 | 135.00 | 112.00 | 337.00 | c |
The orchard-blocked analysis of log10(MS/g + 1) showed a strong categorical stage effect (F(3,12) = 79.98, P < 0.0001; partial η2 = 0.952). The Friedman blocked test gave the same qualitative conclusion (χ2 = 14.04, P = 0.0029). Holm-adjusted paired comparisons separated stages 0 and 1 from the higher stages, whereas stages 2 and 3 were not significantly different after adjustment (adjusted P = 0.083). Fig. 2 shows the orchard-stage distributions and group letters, and Fig. 3 shows within-orchard trajectories with technical plate standard errors on a logarithmic y-axis. All five orchards increased markedly from stage 0 to stage 2, whereas the change from stage 2 to stage 3 varied among orchards.
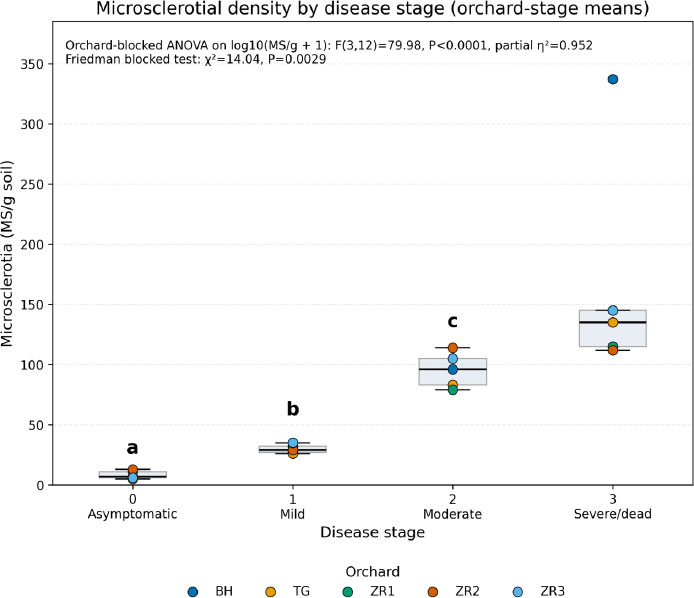
Microsclerotial density by disease stage. The y-axis shows MS/g soil on the original scale. Box plots summarize the median and interquartile range of the five orchard-stage means, and colored symbols identify individual orchards. Letters above stages denote Holm-adjusted paired-comparison groups from analyses of log10(MS/g + 1). The annotation reports the orchard-blocked ANOVA, partial η2, and Friedman blocked test.
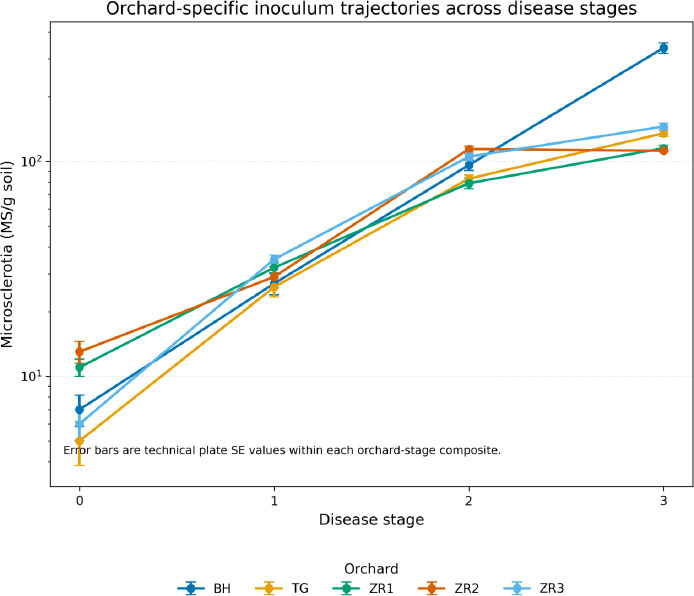
Orchard-specific microsclerotial trajectories across disease stages. The x-axis gives the ordinal stages (0, asymptomatic; 1, mild; 2, moderate; 3, severe/dead), and the logarithmic y-axis gives MS/g soil. Each line represents one orchard. Error bars are standard errors calculated from the three technical plate counts within each orchard-stage composite and therefore describe enumeration precision, not independent field-sampling variation.
3.3. Cluster-aware Stage Trend, Sensitivity Analysis, and Observed Ranges
In the orchard-fixed-effects regression, the ordered stage coefficient was β = 0.421 log10 units per stage (95% CI, 0.351-0.491; P < 0.0001), and the model explained 92.2% of the variation in transformed inoculum density (R2 = 0.922). This coefficient corresponds to a 2.64-fold increase in MS/g + 1 for each one-stage increase (95% CI, 2.24-3.10). The orchard-cluster bootstrap yielded a similar 95% interval for β (0.354-0.488). The descriptive Spearman coefficient across the 20 orchard-stage cells was ρ = 0.962. Excluding the high BH stage-3 observation changed ρ only to 0.961 and gave β = 0.405 (95% CI, 0.331-0.478; R2 = 0.919). In leave-one-orchard-out analyses, β ranged from 0.391 to 0.444 log10 units per stage. Thus, the association was not dependent on the BH stage-3 value or on any single orchard (Fig. 4; Supplementary Table S6).
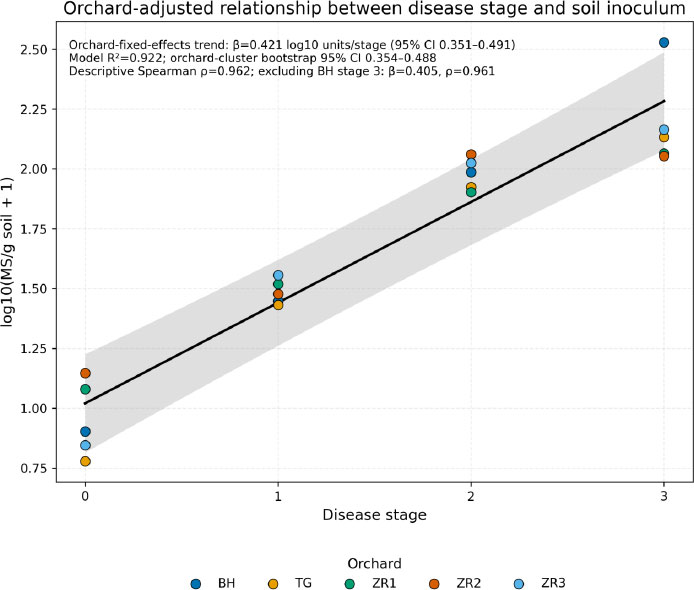
Orchard-adjusted relationship between disease stage and soil inoculum. Symbols show the 20 orchard-stage means after transformation to log10(MS/g + 1), with color identifying the orchard. The solid line visualizes the balanced orchard-fixed-effects stage trend and the shaded band its 95% mean confidence interval. The annotation reports β and its 95% CI, model R2, the orchard-cluster-bootstrap 95% CI, descriptive Spearman ρ, and the sensitivity analysis excluding BH stage 3. No predictive risk thresholds are displayed.
The stage-specific orchard means occupied the following observed ranges: 5-13 MS/g at stage 0, 26-35 MS/g at stage 1, 79-114 MS/g at stage 2, and 112-337 MS/g at stage 3. These values are empirical ranges from the present 20 cells, not independently defined thresholds. In particular, the absence of orchard-stage means between 35 and 79 MS/g is a sampling gap in this small dataset rather than evidence for a biological breakpoint, and the overlap between stages 2 and 3 at approximately 112-114 MS/g further argues against a deterministic cutoff. No predictive 'low-risk,' 'warning,' or 'high-risk' classes are assigned.
3.4. qPCR Standard-curve Performance
The reconstructed plasmid-standard curves were highly linear across the summarized dilution range (Table 3). For the inter-assay summaries, the reconstructed slope was -3.45, the intercept was 35.19, R2 = 0.9998, and amplification efficiency was 94.95%. Corresponding intra-assay values were -3.45, 35.23, 0.9995, and 94.76%. Summarized coefficients of variation remained below 1% from 5 × 10^6 to 50 copies/µL and increased at 5 copies/µL. Fig. 5A-C visualizes the reconstructed standard curves, Ct dispersion, and reproducibility summaries, whereas (Fig. 5D) shows the supplied IGS copy-number calibration signal.
| Dataset | Slope | Intercept | R2 | PCR efficiency (%) |
|---|---|---|---|---|
| Inter-assay | -3.45 | 35.19 | 0.9998 | 94.95 |
| Intra-assay | -3.45 | 35.23 | 0.9995 | 94.76 |
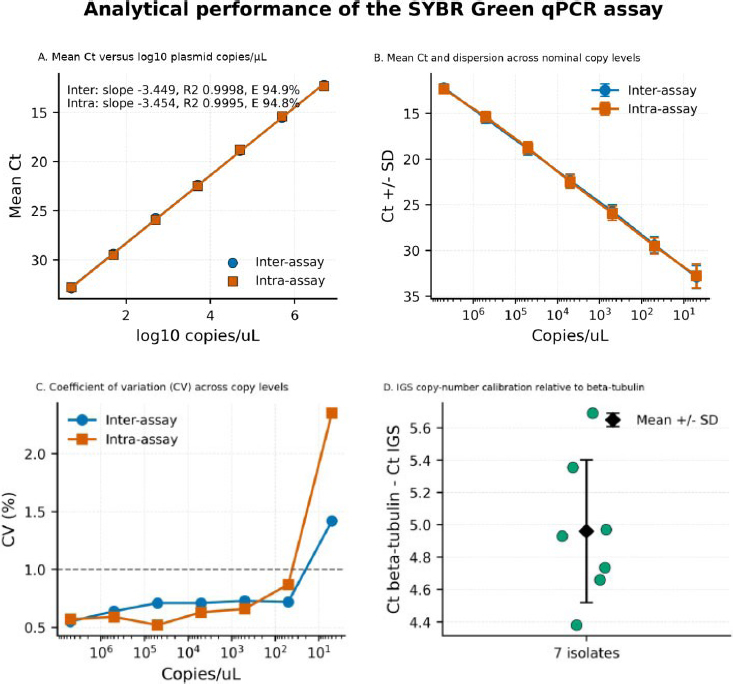
Analytical performance of the IGS-targeted SYBR Green qPCR assay reconstructed from summarized Ct data. (A) Mean Ct versus log10 plasmid copies/µL for inter-assay and intra-assay summaries, with reconstructed slopes, R2 values, and amplification efficiencies. (B) Mean Ct and summarized dispersion across nominal copy levels. (C) Coefficient of Variation (CV, %) across copy levels; the dashed line indicates 1% CV. (D) Supplied IGS copy-number calibration signal relative to beta-tubulin for seven isolates; points represent isolate summaries and the black symbol/error bar represents mean ± SD. These panels characterize plasmid-standard reproducibility and calibration only and do not represent quantitative performance in orchard soil.
These values describe summarized analytical information from the previously published assay platform [21] and are included for provenance and methodological context only. They do not constitute a new field validation and do not demonstrate equivalent performance in the present orchard soil dataset. The available archive does not support estimates of field-sample sensitivity, specificity, extraction recovery, inhibition, or agreement with culturable MS/g; accordingly, the qPCR summaries do not provide independent evidence for the principal field association.
4. DISCUSSION
The principal result is a strong association between ordinal wilt stage and culturable soil microsclerotial density across the five surveyed orchards. Importantly, the analytical framework treats the 20 orchard-stage cells as observations clustered within five orchards rather than as 20 independent field replicates. The orchard-blocked categorical test showed a large stage effect (partial η2 = 0.952), while the orchard-fixed-effects trend estimated a 2.64-fold increase in MS/g + 1 per stage. The cluster-bootstrap interval and leave-one-orchard-out analyses were consistent with the fitted trend, and removal of the BH stage-3 value had little effect on either β or descriptive ρ. These results support robustness of the association within this dataset without enlarging the effective number of orchards.
The direction of that association cannot be established from the cross-sectional design. Microsclerotia are long-lived survival structures that can increase the probability of root contact and infection [5-8], but infected roots and senescing tissues can also return pathogen propagules to the soil. Because soil was sampled around trees already assigned to symptom stages, the study cannot separate pre-existing inoculum pressure from inoculum accumulated during or after disease development. The measured MS/g values should therefore be interpreted as correlates of existing disease stage, not as demonstrated predictors of future disease. A prospective design beginning before symptom development is required to establish temporal direction [8, 13].
For the same reason, numerical risk classes are not assigned in this study. The present data show observed stage-specific ranges, including a conspicuous unsampled interval between 35 and 79 MS/g, but that interval is a feature of only 20 orchard-stage cells and does not demonstrate a biological breakpoint. Moreover, stage-2 and stage-3 ranges overlap at approximately 112-114 MS/g. Inoculum-density thresholds reported under controlled infestation cannot be transferred directly to these mature field orchards because pathotype, cultivar, soil conditions, and sampling protocols differ [8, 9, 13-17]. Any future operational cutoff should be defined prospectively and validated in independent orchards against subsequent disease outcomes.
The orchard metadata reinforce this need for external validation. All five orchards had previous potato cultivation; two also had melon; the irrigation system was confounded with orchard identity, and only five orchard-level incidence values were available. These variables are epidemiologically plausible modifiers of soil inoculum and disease expression, but the present design cannot estimate their independent effects. Likewise, pathotype, cultivar identity, and soil physicochemical properties were not retained for stratified analysis. Variation among olive genotypes and V. dahliae populations, together with climatic and water-related effects, makes a single universal inoculum-response function unlikely [13-18, 44].
Interpretation also depends on the pre-analytical and laboratory sampling chain. Wet-sieving and selective plating provide a biologically meaningful estimate of culturable propagules, but recovery depends on soil processing, selective medium, and microsclerotial distribution [9-12]. The retained record did not preserve the number or spatial arrangement of field cores, sampling depth, trunk distance, rhizosphere/bulk-soil distinction, season, tree-level replication, or storage conditions for the orchard-stage composites. This is a substantive limitation because microsclerotia can be spatially aggregated and a composite mean cannot recover tree-level or core-level heterogeneity [12]. The reproducible laboratory protocol is stated explicitly, but the missing field metadata prevent retrospective estimation of pre-analytical sampling variance. Consequently, interpretation is restricted to retained observations, while the detailed sampling specifications apply only to future work.
The qPCR component must be interpreted even more narrowly. High R2 values and approximately 95% efficiency indicate internally coherent plasmid-standard curves, but they do not establish quantitative recovery from orchard soil. Soil DNA extraction, co-extracted inhibitors, target-copy variation, and DNA from nonviable material can decouple molecular signal from culturable MS/g [19-21]. MIQE guidance emphasizes the need to document these matrix-dependent steps [26, 27]. Without matched field Ct values, extraction-recovery measurements, and inhibition controls, the qPCR summaries serve only to document the analytical calibration available for the assay and do not corroborate the field regression.
External evidence supports the same need for context-aware interpretation. Rhizosphere and xylem microbiome studies, fertilization and irrigation experiments, long-term orchard work, and biological-control studies show that disease expression and microsclerotial behavior can be modified by site, host, management, and microbial interactions [45-54]. These reports do not provide transferable numerical cutoffs for the present orchards; rather, they identify covariates that should be prespecified in future validation.
Independent olive breeding, diagnostic, and epidemiological studies also show that resistance, pathogen distribution within infected trees, assay matrix, and inoculum-density response can alter apparent disease-risk relationships [55-64]. Comparable work in potato and other crops demonstrates the value of explicit biological replication, soil- or tissue-matrix validation, and longitudinal disease assessment when inoculum is used for inference [65-70]. Classic and modern Verticillium literature further emphasizes integrated management, host-pathogen specificity, taxonomic context, and non-linear dose-response behavior [71-75]. Together, this broader evidence supports the present manuscript's conservative focus on association rather than prediction.
A decisive validation study should therefore be prospective, spatially explicit, and hierarchical. The prespecified framework in Section 2.1.1 and Supplementary Table S7 operationalizes this need by proposing independent tree-level replication, 12 cores per tree across four cardinal directions and three trunk distances (25, 50, and 100 cm), a defined 0-30 cm depth, separate bulk/core and rhizosphere matrices, two seasonal sampling windows, tree-level compositing, controlled air-drying and storage, and a defined processing interval. These specifications were not applied retrospectively to the current dataset. Future orchards should also represent major Tunisian cultivars, soil types, irrigation regimes, and crop histories, while pathogen populations should be characterized at least for pathotype. Standardized plating and a soil-matrix-calibrated molecular assay with extraction and inhibition controls should be applied to matched aliquots. Repeated tree assessments could then relate baseline inoculum to subsequent incidence, severity, recovery, mortality, and yield using mixed-effects or other hierarchical models, with independent orchards reserved for external validation [4, 19-21].
Within these constraints, the present dataset provides a focused field observation: higher culturable soil microsclerotial density accompanies a more advanced olive wilt stage in the surveyed Tunisian orchards, and that pattern remains strong after accounting for orchard clustering and the influence of the highest observation. The result can justify intensified diagnostic sampling or stratification of future studies around heavily affected foci, but it does not justify irreversible management decisions from a numerical MS/g cutoff alone. The practical value of soil inoculum testing will depend on pairing standardized sampling with information on cultivar, pathotype, site history, and longitudinal disease data [4, 8, 13].
5. LIMITATIONS OF THE STUDY
The study has important strengths: it reports a strong, orchard-adjusted association between soil microsclerotial density and wilt stage, uses cluster-aware statistics and sensitivity analyses, and interprets the qPCR data cautiously as evidence of assay provenance rather than field validation. These features support the internal robustness of the observed pattern. However, the cross-sectional design cannot establish temporal direction, because high inoculum may precede infection or accumulate after root and residue decay. The archived field record also lacks tree- and core-level metadata, so field-sampling variance and spatial aggregation cannot be quantified. With only five orchards, orchard identity is confounded with irrigation, crop history, and other site factors, limiting independent covariate inference. The 20 orchard-stage composites provide useful local estimates but cannot define validated thresholds, and the gap between 35 and 79 MS/g may be a sampling artifact rather than a biological breakpoint. The qPCR summaries document analytical calibration but cannot corroborate plating without matched soil aliquots, extraction recovery, inhibition controls, and matrix-specific calibration. Potential selection, sampling, and measurement biases further restrict generalization beyond these Tunisian orchards. Accordingly, the association is best viewed as a robust hypothesis-generating finding that justifies prospective, spatially standardized, independently replicated studies with pathotype and cultivar characterization and matched culture-molecular measurements. Such validation is needed before numerical MS/g values are used for operational decisions.
CONCLUSION
Soil microsclerotial density of Verticillium dahliae was strongly associated with ordinal Verticillium wilt stage across five Tunisian olive orchards. Orchard-blocked and orchard-adjusted analyses, cluster-bootstrap uncertainty, and influence checks supported the robustness of this within-dataset association, including after the exclusion of the high BH stage-3 value. Because the survey was cross-sectional and tree/core-level field-sampling metadata were not preserved, the observed MS/g ranges cannot be interpreted as causal or predictive disease thresholds, and field-sampling variance cannot be reconstructed. The IGS-targeted qPCR material derives from the previously published assay platform [21] and is reported only as analytical provenance; it is not a new field validation or independent confirmation of the plating association. Prospective, spatially standardized studies with independent tree replication, pathotype and cultivar characterization, soil covariates, matched culture-molecular measurements, and external validation are required before numerical thresholds are used for operational decisions.
AUTHORS’ CONTRIBUTIONS
The authors confirm their contribution to the paper as follows: Y.G.: Conceived and designed the study, supervised the experiments, analyzed the data, and drafted the manuscript; E.B.: Performed laboratory assays and contributed to data collection. M.A.T.: Contributed to conceptualization, supervision, interpretation of results, and critical revision of the manuscript. All authors reviewed the results and approved the final version of the manuscript.
LIST OF ABBREVIATIONS
| ANOVA | = Analysis of Variance |
| CI | = Confidence Interval |
| Ct | = Cycle Threshold |
| CV | = Coefficient of Variation |
| EPAA | = Ethanol Potassium Amoxicillin Agar |
| IGS | = Intergenic Spacer |
| LAMP | = Loop-Mediated Isothermal Amplification |
| LOD | = Limit of Detection |
| LOQ | = Limit of Quantification |
| MS | = Microsclerotia |
| MS/g | = Microsclerotia Per Gram of Soil |
| PCR | = Polymerase Chain Reaction |
| qPCR | = Quantitative Polymerase Chain Reaction |
| RPA | = Recombinase Polymerase Amplification |
| SD | = Standard Deviation |
| SE | = Standard Error |
AVAILABILITY OF DATA AND MATERIALS
The authors confirm that the retained data supporting the present analyses are available within the article and Supplementary Material S1, including replicate-level plate counts, orchard-stage summaries, pairwise contrasts, qPCR calibration summaries, and cluster-aware sensitivity outputs. Detailed tree/core-level field metadata required for full reconstruction were not preserved in the archived record and therefore are not supplied or imputed. The prospective sampling and quality-control specifications in Supplementary Tables S6-S7 are design recommendations only and are not empirical observations from the archived survey.
FUNDING
This work was financially supported by the Laboratory of Olive Genetic Resources: Characterization, Valorization and Phytosanitary Protection (LR16IO01).
ACKNOWLEDGEMENTS
The authors gratefully acknowledge the farmers who granted access to their olive orchards and facilitated field sampling. Their cooperation was essential to the surveys and soil collection.