All published articles of this journal are available on ScienceDirect.

Multicriteria Analysis Model in Sustainable Corn Farming Area Planning
Authors Info & Affiliations
Abstract
Introduction
This research aims to develop a framework for multicriteria analysis to evaluate alternatives for sustainable corn agricultural area planning, considering the integration of ecological, economic, and social aspects as pillars of sustainability.
Methods
The research method uses qualitative and quantitative approaches to integrate ecological, economic, and social aspect in the multicriteria analysis. The analysis involves land evaluation, sub criteria identification and data integration using Multidimensional Scaling and Analysis Hierarchy Process methods to prioritize developing sustainable corn agricultural areas.
Results
Based on the results and analysis, it indicates that the ecological dimension depicts less sustainability. The Analytical Hierarchy Process results yield weight distribution and highly relevant scores that describe tangible preferences.
Conclusion
Priority directions are grouped as strategic steps toward achieving the goals of sustainable corn agricultural area planning.
1. INTRODUCTION
Corn farming is one of the vital sectors of the Indonesian economy [1]. Bengo is one of the areas in Bone Regency with the highest corn production in South Sulawesi [2]. Corn agricultural areas play an important role in providing food security and increasing farmers' income. However, developing planning for these areas cannot rely solely on one aspect but must consider various complex and sustainable factors [3]. The pillars of sustainable development are based on ecological, economic, and social aspects [4]. Multicriteria analysis helps in evaluating decision support systems for assessing alternative agricultural area planning [5]. Spatial multicriteria analysis integrates geographic data and value assessments to enable balanced decision-making across various parameters, encompassing economic, social, technical, and environmental aspects [6, 7]. This approach offers advantages in providing comprehensive assessments of relevant aspects. Challenges of this approach include complexity, difficulty in integration and the subjective element of criterion importance levels [8, 9]; thus, a multi-criteria technique for multivariate systems is necessary to ensure objectivity and logical decision-making [10]. Multidimensional Scaling (MDS) is a multivariate analysis technique that can help in visualizing the relationship between alternatives and criteria in multidimensional spaces [11, 12], which allows us to visually understand issues on ecological, economic, and social aspects of corn farming planning. The Analytic Hierarchy Process (AHP) is a decision-making method to solve complex problems by separating several criteria and sub-criteria to measure quantitative preferences of criteria [13, 14]. The combination of MDS and AHP in multiple criteria decision analysis will provide a holistic and structured approach to evaluating more informed and data-based planning alternatives. The study provides a concrete overview and valuable insight into the application of a multi-criterion model in evaluating sustainable corn area planning alternatives through a combination of MDS and AHP. The main objective of the study is to develop a framework for multi-criterion analysis that can be used to evaluate alternatives to corn agricultural area planning, considering the integration of ecological, economic, and social aspects as a pillar of sustainability. This paper presents a multi-functional analysis model for corn cultivation in Indonesia to evaluate alternative sustainable corn agricultural area planning, integrating ecological, economic, and social aspects as pillars of sustainability.
2. MATERIALS AND METHODS
This research was conducted in Bengo District, Bone Regency, South Sulawesi Province, from March to November 2023. Primary data was obtained through field surveys and a series of interviews with stakeholders/ experts. This research uses qualitative and quantitative descriptive approaches in integrating various aspects of land, ecological, economics and social diversity in a multi-criteria analysis. This research design includes stages starting from land evaluation, identification of sub-criteria to data analysis and formulation of recommendations for planning a sustainable corn farming area.
2.1. Land Suitability Analysis of Corn Plants
This analysis aims to determine land suitability by matching land characteristics with criteria for growing corn. The land suitability study for corn cultivation was conducted on land units obtained from overlaying data from the Soil Map, Slope Gradient from DEM SRTM, and Land Use for paddy fields specifically for fields planted with corn. Each land unit (Lu) is then matched with land suitability criteria from Puslitanak (Center for Soil and Agroclimatic Research) of the Agency for Agricultural Research and Development [15]. Land suitability classification is based on Food and Agriculture Organization (FAO) criteria, with classes S1 (very suitable), S2 (moderately suitable), S3 (marginally suitable), and N (not suitable).
2.2. Determination of Sub-criteria for Ecological, Social, and Economic Aspects
The relevant sub criteria will be identified through a literature review, consultation with experts, and discussions with stakeholders involved in sustainable agricultural planning. These sub-criteria will encompass aspects of sustainability in ecological, social, and economic dimensions. Data will be gathered from various sources, including secondary data from literature reviews [16, 17], data from relevant agencies or governmental institutions, and primary data from field surveys and interviews. Data collection methods will be tailored to each aspect under investigation.
2.3. Integration Analysis of Ecological, Economic and Social Aspects of Corn Farming Planning
The results of the land suitability analysis of corn crops are then collected sub criteria data from the ecological, social, and economic aspects of the sustainability of corn farming. The data that has been collected will be further analyzed using statistical methods and multivariate analysis techniques. Analysis will be conducted for each ecological, social, and economic aspect, considering the principles of sustainability, using the MDS method. The analysis is carried out with the ordination technique called RAP-Corn (Rapid Appraisal for Corn) modified from RAPFISH [18]. The ordination technique in MDS is based on the Euclidean Distance from the bad, medium, and good assessment results for each aspect sub-criteria. The ordination technique within MDS is based on Euclidean Distance. The regression technique described above is the ALSCAL algorithm [19]. Eq. (1) is written as:
 |
(1) |
The analysis is conducted in Microsoft Excel and is named RAP-Corn (Rapid Appraisal for Corn). This analysis represents an integrated approach to generate holistic assessments of sustainable corn farming area planning alternatives. The results of the MDS analysis will provide index values and sustainability status for ecological, economic, and social aspects (Table 1).
| Index Value | Category |
|---|---|
| 0.00 – 25.00 | Not Sustainable |
| 25.01 – 50.00 | Less Sustainable |
| 50.01 – 75.00 | Quite Sustainable |
| 75.01 – 100.00 | Very Sustainable |
The results of the MDS analysis will provide leverage attributes for sustainability. These leverage attributes will be integrated into the AHP to gain a deeper understanding of the pairwise comparison structure found in the multidimensional analysis.
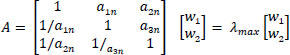
AHP is a multi-criteria decision-making method that employs a hierarchical approach to assign weights to variables. The goal of AHP is to prioritize alternatives more systematically based on identified preferences. This method uses a scale of values from 1 to 9 (Table 2) to depict the relative importance levels among attributes. Evaluation is performed using a pairwise comparison matrix where criteria and alternatives are assessed relative to the established goals. Matrix A (n x n) is created based on the number of criteria n (Eq. 2), then normalization is performed (Eq. 3), followed by eigenvector calculation (Eq. 4), Consistency Index (CI) calculation was performed in Equation 5, and Consistency Ratio (CR) calculation with Equation 6. The random index (RI) was calculated, according to Table 3. If the CR value > 1.0, it indicates poor consistency. If CR < 0.10, then the matrix is considered consistent and acceptable [20, 21].
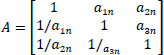 |
(2) |
 |
(3) |
 |
(4) |
Where W is the matrix weight of the criteria, λ max is the largest eigenvalue
 |
(5) |
 |
(6) |
The goal of this integration is to obtain balanced weights, scores, and class values for each aspect in the assessment of planning alternatives on the criteria and sub-criteria of Ecological Sustainability (S-Ecological), Economic Sustainability (S-Economic), and Social Sustainability (S-Social).
2.4. Analysis of Sustainable Corn Farming Area Development
Sustainable corn development planning analysis is carried out through a spatial statistical analysis approach by performing mathematical calculations of the sustainability of ecological, economic, and social aspects with simple logarithms as follows:
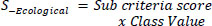 |
(7) |
 |
(8) |
 |
(9) |
The result of the above formula is then calculated through raster analysis of Sustainable Corn Farming Area Development Planning (SP-Corn) with the following equation:
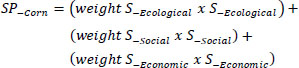 |
(10) |
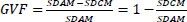
The equation yields value from the combined integration of sustainability pillars, which will then be divided into three priority classes of development. The categorization is based on natural breaks, the most accurate method for tabular data and has a picture of the smallest error volume based on the natural interval patterns of the data [22, 23]. This method calculates the Goodness of Variance Fit (GVF) with the following equation (Jenks, 1963):
 |
(11) |
SDAM (Sum of squared Deviations for Array Mean) indicates variance between classes; SDCM (Sum of squared deviations for Class Means) declares variance for each class.
| Intensity of Importance | Definition | Explanation |
|---|---|---|
| 1 | Equal importance | Two activities contribute equally to the objective |
| 3 | Moderate importance of one over another | Experience and judgment seem to favor one activity over another |
| 5 | Essential or strong importance | Experience and judgment strongly favor one activity |
| 7 | Very strong importance | An activity is strongly favored, and its dominance demonstrated in practice |
| 9 | Extreme importance | The evidence favoring one activity over another is of the highest possible order of affirmation |
| 2,4,6,8 | Intermediate values between the two adjacent judgments | When compromise is needed |
| Reciprocals | If activity I has one of the above numbers assigned to it when compared with activity j, then j has the recipr0cal value when compared with i | - |
| Rationals | Ratios arising from the scale | If consistency were to be forced by obtaining n numerical values to span the matrix |
3. RESULTS AND DISCUSSION
3.1. Land Suitability Analysis
Land suitability analysis is an assessment of land quality regarding the suitability of cultivated crops, which influences its potential use as opportunities and challenges in managing and optimizing land productivity. The research results show that the land suitability class that dominates the study area is the S3 (Marginally Suitable) class with two subclasses, namely S3rf covering an area of 5,381.66 hectares and S3rfn covering an area of 559.43 hectares. The S3rf subclass reflects limitations on rooting media and nutrient retention factors, while S3rfn has additional constraints on nutrient availability factors. These findings indicate that most of the land in the study area is less suitable for maize farming without significant management intervention. The detail of land suitability class values is presented in Table 4, and the distribution area of the land suitability is presented in Fig. (1).
This land suitability includes various combinations of limiting factors such as drainage (r), base saturation (f), and k20 (n). Disturbed drainage can cause waterlogging, which is harmful to plant growth [24] and limits the choice of crops that can be planted. High base saturation can cause a variety of soil nutritional and physical problems that inhibit root development and nutrient uptake. An unbalanced k20 content can disrupt the nutritional balance of plants and affect productivity [25]. Therefore, careful management strategies are needed to overcome these limiting factors through effective drainage management, adjusting soil pH, or appropriate fertilization to improve land conditions and increase corn production potential [26, 27].
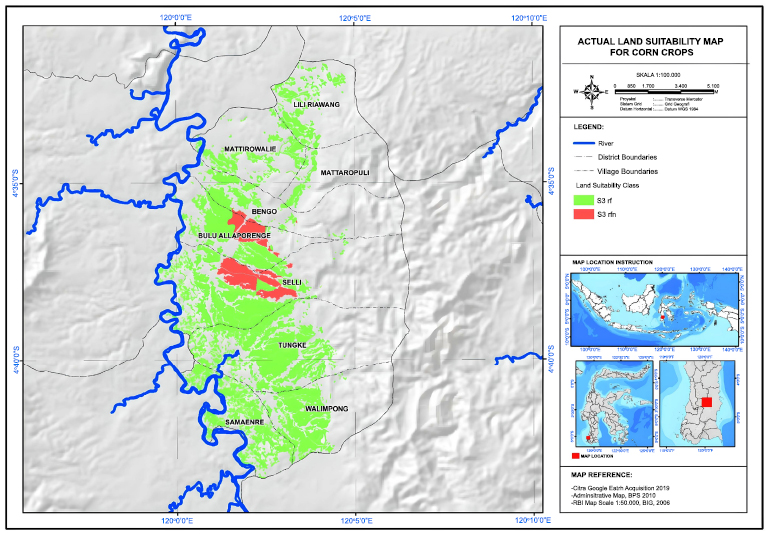
Map of Actual Land Suitability for Corn Crops, S3 indicates the class of marginal land suitability with limiting factors of drainage (r), high base saturation (f), and unbalanced K20.
| Land Quality/characteristics | Land Suitability | |||||||||||
|---|---|---|---|---|---|---|---|---|---|---|---|---|
| Lu 1 | Class | Lu 2 | Class | Lu 3 | Class | Lu 4 | Class | Lu 5 | Class | Lu 6 | Class | |
| Temperature | - | - | - | - | - | - | - | - | - | - | - | - |
| Annual average (C) | 25,8 | S1 | 25,8 | S1 | 25,8 | S1 | 25,8 | S1 | 25,8 | S1 | 25,8 | S1 |
| Water availability (w) | - | - | - | - | - | - | - | - | - | - | - | - |
| Dry Month (<75mm) | 3 | S1 | 3 | S1 | 3 | S1 | 3 | S1 | 3 | S1 | 3 | S1 |
| Annual rainfall (mm) | 1872,8 | S1 | 1872,8 | S1 | 1872,8 | S1 | 1872,8 | S1 | 1872,8 | S1 | 1872,8 | S1 |
| Humidity | 82,40% | S1 | 82,40% | S1 | 82,40% | S1 | 82,40% | S1 | 82,40% | S1 | 82,40% | S1 |
| Rooting medium (r) | - | - | - | - | - | - | - | - | - | - | - | - |
| Soil drainage | Hampered | S3 | Hampered | S3 | Hampered | S3 | Hampered | S3 | Hampered | S3 | Hampered | S3 |
| Soil texture | Clay | S1 | Clay | S1 | Clay | S1 | Clay | S1 | Clay | S1 | Clay | S1 |
| Effective depth (cm) | 50 cm | S1 | 50 cm | S1 | 50 cm | S1 | 50 cm | S1 | 50 cm | S1 | 50 cm | S1 |
| Nutrient retention (f) | - | - | - | - | - | - | - | - | - | - | - | - |
| KTK | 25,21 | S1 | 28,42 | S1 | 24,53 | S1 | 24,86 | S1 | 25,27 | S1 | 26,2 | S1 |
| Base Saturation (%) | 30 | S3 | 21 | S3 | 33 | S3 | 35 | S2 | 22 | S3 | 30 | S3 |
| Soil pH | 6,01 | S3 | 5,98 | S3 | 6,12 | S3 | 6,85 | S3 | 5,68 | S3 | 6,4 | S3 |
| C-Organic | 1,57 | S1 | 0,87 | S1 | 1,68 | S1 | 2,24 | S1 | 0,84 | S1 | 1,96 | S1 |
| Nutrients available (n) | - | - | - | - | - | - | - | - | - | - | - | - |
| N-Total (%) | 0,22 | S1 | 0,18 | S1 | 0,24 | S1 | 0,31 | S1 | 0,17 | S1 | 0,23 | S1 |
| P2O5 | 10,42 | S2 | 9,6 | S2 | 14,71 | S2 | 15,12 | S2 | 10,48 | S2 | 10,07 | S2 |
| K2O | 0,33 | S2 | 0,44 | S3 | 0,34 | S2 | 0,14 | S2 | 0,21 | S2 | 0,36 | S2 |
| Erosion hazard level (e) | - | - | - | - | - | - | - | - | - | - | - | - |
| Danger of erosion | Very Light | S1 | Very Light | S1 | Very Light | S1 | Very Light | S1 | Very Light | S1 | Very Light | S1 |
| Slope | < 8 % | S1 | < 8 % | S1 | < 8 % | S1 | < 8 % | S1 | < 8 % | S1 | < 8 % | S1 |
| Flood danger (b) | F0 | S1 | F0 | S1 | F0 | S1 | F0 | S1 | F0 | S1 | F0 | S1 |
| Actual Land Suitability Class | - | S3rf | - | S3rfn | - | S3rf | - | S3rf | - | S3rf | - | S3rf |
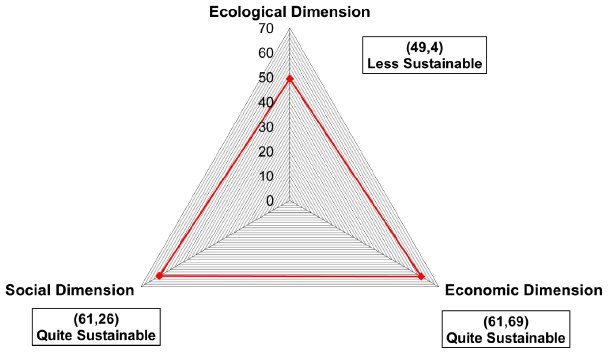
Sustainability kite diagram for corn agricultural area planning.
3.2. Multidimensional Scaling Analysis for Sustainable Corn Agricultural Development Planning
The data collection process through literature review and in-depth analysis has produced several important sub-criteria from ecological, economic, and social aspects. From an ecological perspective, the sub-criteria identified include the sustainability of natural resources, biodiversity, and the environmental impact of human activities [28, 29]. The economic aspect highlights sub-criteria such as efficient use of resources, potential for economic growth, and contribution to societal welfare [30]. Meanwhile, from a social perspective, sub-criteria include community involvement, social justice, and quality of life [31]. The identified criteria and sub-criteria are then subjected to a comprehensive evaluation, assessing their strengths and weaknesses, with assessments based on specific indicators.
These sub-criteria are utilized in the sustainability analysis of corn cultivation using the rap-corn ordination technique. This method is a statistical technique involving multidimensional transformation. The analysis can better illustrate the distribution and factors influencing the sustainability of corn cultivation in the study area. This ordination technique aids in understanding the complex patterns associated with sustainability aspects [32], as shown in the kite diagram (Fig. 2).
Based on the results of the rap-corn analysis on the kite diagram, the ecological dimension depicts less sustainability with an index value of 49.40%, indicating significant ecological imbalance and vulnerability. Meanwhile, the economic dimension index has a value of 61.69%, and the social dimension index is 61.26%, indicating relatively sustainable economic growth and improved community well-being. These results suggest that although some aspects achieve a relatively sustainable level, further efforts are needed to enhance ecological balance and reduce economic and social inequality to achieve a more holistic sustainability (Fig. 3a-c).
The assessment of the ecological dimension sustainability status involves 11 attributes (Fig. 3d). Leveraging attributes related to the ecological dimension index shows a root mean square (rms) value of 3.46 for soil organic carbon content suitability, 3.06 for biological agent utilization, and 1.3 for fertilization, which play crucial roles in determining the ecological sustainability of an agricultural system. These attributes are sensitive factors that need to be considered for improvement in practices supporting environmental sustainability. Improvements in fertilization and the use of organic materials can help reduce soil degradation, enhance crop productivity, and achieve better and more sustainable ecological balance [26, 27].
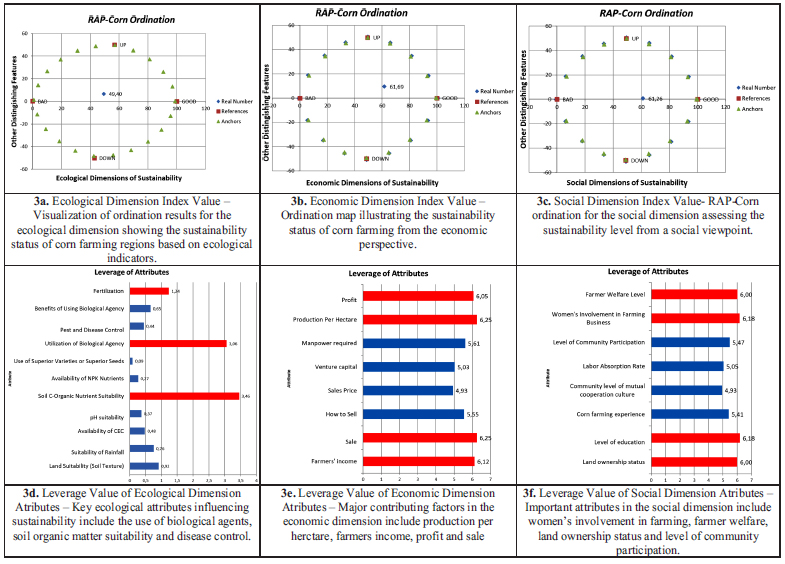
Index values and leverage attributes of ecological, economic, and social dimensions.
The leveraged attributes related to the economic dimension (Fig. 3e) with an RMS value of 6.05 for profit, 6.25 for production per hectare, 6.25 for sales, and 6.12 for farmer income are crucial sensitive factors. Profitability is the main focus for farmers and increasing production per hectare is key to boosting agricultural product sales, thus increasing farmers' income [33]. Therefore, to enhance economic welfare in the agricultural sector, it is essential to consider and improve performance in terms of profit, production per hectare, sales, and farmer income.
The leveraged attributes from the social dimension (Fig. 3f) show an RMS value of 6.00 for the farmer welfare level. The farmer welfare level emphasizes the need for farmers to have sufficient access to resources and services that support their well-being [34]. Women's involvement in agricultural business, with a value of 6.18, highlights the crucial role of women in the agricultural sector and the overall economy [35]. The education level, with a value of 6.18, emphasizes that higher education can provide farmers with broader opportunities for more sustainable and efficient farming practices [36]. Meanwhile, the rms value for land ownership status is 6.0. Land ownership status can influence farmers' active involvement in managing and developing sustainable agricultural land [37]. Therefore, to improve social conditions and farmer welfare, it is essential to consider and enhance performance in terms of farmer welfare, women's involvement in agricultural business, education level, and land ownership status.
3.3. Weight Analysis of Ecological, Economic and Social Criteria
Integration of ecological, economic, and social aspects is an approach that considers the impact of activities or policies on the environment, economy, and society simultaneously. The AHP method is used to obtain scores and weights for relevant criteria in each attribute that acts as leveraged factors for sustainability from the results of the MDS analysis. The AHP results yield the weight values for each criterion (Table 5), with the ecological aspect having a weight of 0.63, the economic aspect with a weight of 0.26, and the social aspect obtaining a weight of 0.11.
The ecological aspect consists of 3 criteria, namely fertilization, organic material utilization, and soil organic carbon content suitability. The economic aspect includes 4 criteria: profit, production per hectare, sales per hectare, and farmer income per month. Meanwhile, the social aspect consists of 4 criteria, namely farmer welfare level, women's involvement in agricultural business, education level, and land ownership status (Table 6).
The AHP results produce a score for each indicator according to its importance in achieving the sustainability goals of corn farming. Fertilization received a score of 0.65, which reflects the effectiveness of fertilizer use in corn farming. Using appropriate fertilizer can minimize negative impacts on the environment [38, 39]. The use of organic materials received a score of 0.23, which shows the extent of the use of organic materials in corn fields. The use of organic materials can increase soil fertility, reduce the need for chemical fertilizers, and overall improve soil quality [38]. Meanwhile, the suitability of soil organic carbon content received a score of 0.12, which assesses the suitability of soil organic nutrients in supporting the growth of corn plants. The availability of sufficient nutrients in the soil is very important for optimal plant growth and plays a role in maintaining the balance of the soil ecosystem [39]. The AHP ecological sub-criteria class score values are presented in the following Tables: 7-9.
| Criteria | Ecological Aspects | Economic Aspects | Sosial Aspects | Priority Vector (W) | Vector Product | Lamda Eigenvalue |
|---|---|---|---|---|---|---|
| Ecological | 1 | 3,00 | 5,00 | 0,63 | 1,95 | 3,07 |
| Economic | 0,33 | 1 | 3,00 | 0,26 | 0,79 | 3,03 |
| Social | 0,20 | 0,33 | 1 | 0,11 | 0,32 | 3,01 |
| Ecological Sub Criteria | Fertilization | Use of Organic Ingredients | Soil Organic C Nutrient Suitability | Priority Vector (W) | Vector product | Lamda Eigenvalue |
|---|---|---|---|---|---|---|
| Fertilization | 1 | 3,00 | 5,00 | 0,65 | 1,95 | 3,01 |
| Use of Organic Ingredients | 0,33 | 1 | 2,00 | 0,23 | 0,69 | 3,00 |
| Soil Organic C Nutrient Suitability | 0,20 | 0,50 | 1 | 0,12 | 0,37 | 3,00 |
| Fertilization Class | Not Fertilization | Less Fertilization | Great Fertilization | Priority Vector (W) | Vector Product | Lamd a Eigenvalue |
|---|---|---|---|---|---|---|
| Not Fertilization | 1 | 0,33 | 0,14 | 0,08 | 0,25 | 3,01 |
| Less Fertilization | 3,00 | 1 | 0,20 | 0,19 | 0,59 | 3,04 |
| Great Fertilization | 7,00 | 5,00 | 1 | 0,72 | 2,27 | 3,14 |
| Use of Organic Ingredients Class | Not Use | Less Use | Many Use | Priority Vector (W) | Vector Produvt | Lamda Eigenvalue |
|---|---|---|---|---|---|---|
| Not Use | 1 | 0,20 | 0,14 | 0,07 | 0,22 | 3,01 |
| Less Use | 5,00 | 1 | 0,33 | 0,28 | 0,87 | 3,06 |
| Many Use | 7,00 | 3,00 | 1 | 0,64 | 2,01 | 3,12 |
| Soil Organic C Nutrient Suitability Class | Not Appropriate | Suitable Enough | Suitable | Priority Vector (W) | Vector Product | Lamda Eigenvalue |
|---|---|---|---|---|---|---|
| Not Appropriate | 1 | 0,13 | 0,11 | 0,05 | 0,16 | 3,01 |
| Suitable enough | 8,00 | 1 | 0,33 | 0,31 | 0,95 | 3,12 |
| Suitable | 9,00 | 3,00 | 1 | 0,64 | 2,05 | 3,20 |
The AHP results from the economic aspect provide insight into the value of economic factor scores in the development of sustainable corn agriculture. The profit score obtained was 0.58 referring to the profitability of corn farming. High profits indicate that the business generates sufficient profits to support the sustainability of agricultural operations [40]. Production per hectare with a score of 0.20 shows the productivity of corn farming. High productivity is essential to
ensure agricultural operations are efficient and able to provide sufficient yields to meet market demand [41]. The sales score per hectare is 0.07. High sales volume indicates effective product marketing. Farmer income per month, with a score of 0.14, assesses whether the income earned by farmers each month is sufficient for their welfare. The AHP economic sub-criteria class score values are presented in the following Table: 10-14.
| Economic Sub Criteria | Profit | Production per Hectare | Sales per Hectare | Farmer's Income per Month | Priority Vector (W) | Vector Product | Lamda Eigenvalue |
|---|---|---|---|---|---|---|---|
| Profit | 1 | 5,00 | 7,00 | 3,00 | 0,58 | 2,53 | 4,34 |
| Production per hectare | 0,20 | 1 | 3,00 | 2,00 | 0,20 | 0,82 | 4,09 |
| Sales per hectare | 0,14 | 0,33 | 1 | 0,50 | 0,07 | 0,29 | 4,09 |
| Farmer's income per month | 0,33 | 0,50 | 2,00 | 1 | 0,14 | 0,58 | 4,03 |
| Profit Class | Low | Medium | High | Priority Vector (W) | Vector Product | Lamda Eigenvalue |
|---|---|---|---|---|---|---|
| Low | 1 | 0,17 | 0,11 | 0,06 | 0,18 | 3,02 |
| Medium | 6,00 | 1 | 0,25 | 0,25 | 0,78 | 3,10 |
| High | 9,00 | 4,00 | 1 | 0,69 | 2,22 | 3,22 |
| Production per Hectare Class | < 3 Tons | 3-6 Tons | > 6 Tons | Priority Vector (W) | Vector Product | Lamda Eigenvalue |
|---|---|---|---|---|---|---|
| < 3 tons | 1 | 0,14 | 0,11 | 0,06 | 0,17 | 3,01 |
| 3-6 tons | 7,00 | 1 | 0,33 | 0,29 | 0,91 | 3,08 |
| > 6 tons | 9,00 | 3,00 | 1 | 0,65 | 2,04 | 3,15 |
| Sales per Hectare Class | < 5 Million | 5-10 Million | > 10 Million | Priority Vector (W) | Vector Product | Lamda Eigenvalue |
|---|---|---|---|---|---|---|
| < 5 million | 1 | 0,14 | 0,11 | 0,06 | 0,17 | 3,00 |
| 5-10 million | 7,00 | 1 | 0,50 | 0,35 | 1,05 | 3,02 |
| > 10 million | 9,00 | 2,00 | 1 | 0,60 | 1,81 | 3,04 |
| Farmer's Income per Month Class | < 3 Million | 3 - 6 Million | > 6 Million | Priority Vector (W) | Vector Product | Lamda Eigenvalue |
|---|---|---|---|---|---|---|
| < 3 million | 1 | 0,13 | 0,11 | 0,05 | 0,16 | 3,01 |
| 3 - 6 million | 8,00 | 1 | 0,33 | 0,31 | 0,95 | 3,12 |
| > 6 million | 9,00 | 3,00 | 1 | 0,64 | 2,05 | 3,20 |
The AHP results from the social dimension include four main indicators, each of which has its own score. Farmer welfare received a score of 0.56, which refers to the importance of a good level of farmer welfare in creating a productive work environment and supporting agricultural sustainability in the long term [42]. Women's involvement in agricultural businesses received a score of 0.27, which evaluates the extent to which women can increase productivity and sustainability in agricultural operations. Education level, with a score of 0.11, reflects how a higher level of education can help farmers adopt more innovative and sustainable agricultural practices [36]. Meanwhile, land ownership status received a score of 0.06, indicating that clear and guaranteed ownership status is very important to provide legal certainty to farmers and encourage long-term investment in agricultural development [43]. The AHP social sub-criteria class score values are presented in the following Tables: 15-19.
| Social Sub Criteria | Farmer Welfare Level | Involvement of Women in Agricultural Business | Level of Education | Land Ownership Status | Priority Vector (W) | Vector Product | Lamda Eigenvalue |
|---|---|---|---|---|---|---|---|
| Farmer welfare level | 1 | 3,00 | 5,00 | 7,00 | 0,56 | 2,34 | 4,16 |
| Involvement of women in agricultural business | 0,33 | 1 | 3,00 | 5,00 | 0,27 | 1,09 | 4,08 |
| Level of education | 0,20 | 0,33 | 1 | 2,00 | 0,11 | 0,43 | 4,02 |
| Land Ownership Status | 0,14 | 0,20 | 0,50 | 1 | 0,06 | 0,25 | 4,02 |
| Farmer Welfare Level Class | Low | Medium | High | Priority Vector (W) | Vector Product | Lamda Eigenvalue |
|---|---|---|---|---|---|---|
| Low | 1 | 0,20 | 0,11 | 0,06 | 0,19 | 3,01 |
| Medium | 5,00 | 1 | 0,33 | 0,27 | 0,81 | 3,03 |
| High | 9,00 | 3,00 | 1 | 0,67 | 2,04 | 3,06 |
| Involvement of Women in Agricultural Business Class | Less Involved | Involved | Very Involved | Priority Vector (W) | Vector Product | Lamda Eigenvalue |
|---|---|---|---|---|---|---|
| Less Involved | 1 | 0,13 | 0,11 | 0,05 | 0,16 | 3,01 |
| Involved | 8,00 | 1 | 0,50 | 0,36 | 1,09 | 3,04 |
| Very Involved | 9,00 | 2,00 | 1 | 0,59 | 1,80 | 3,06 |
| Level of education class | SD | SMP-SMA | Bachelor | Priority Vector (W) | Vector product | Lamda Eigenvalue |
|---|---|---|---|---|---|---|
| SD | 1 | 0,20 | 0,11 | 0,06 | 0,19 | 3,01 |
| SMP-SMA | 5,00 | 1 | 0,25 | 0,24 | 0,72 | 3,06 |
| Bachelor | 9,00 | 4,00 | 1 | 0,70 | 2,21 | 3,15 |
| Land Ownership Status class | Farm Workers | Land Rent | Landowner | Priority Vector (W) | Vector Product | Lamda Eigenvalue |
|---|---|---|---|---|---|---|
| Farm Workers | 1 | 0,33 | 0,11 | 0,07 | 0,20 | 3,02 |
| Land Rent | 3,00 | 1 | 0,13 | 0,15 | 0,45 | 3,06 |
| Landowner | 9,00 | 8,00 | 1 | 0,79 | 2,56 | 3,26 |
3.4. Analysis of Sustainable Corn Agricultural Development Planning
Sustainable corn agricultural development planning aims to create a balanced integration of ecological sustainability, economic profitability, and social welfare. Based on the AHP results, weights for criteria and scores for sub-criteria in the ecological, economic, and social aspects have been obtained.
With the weights for criteria and scores for sub-criteria as shown in Fig. (4), the formulation equation for sustainable corn agricultural development planning can be written as follows.
S-Ecological = (0,65 x Fertilization Class Value) + (0,23 x Use of Organic Ingredients Class Value) + (0,12 x Soil Organic C Nutrient Suitability Class Value)
S-Economic = (0,58 x Profit Class Value) + (0,20 x Production per hectare Class Value) + (0,07 x Sales per hectare Class Value) + (0,14 x Farmer's income per month Class Value)
S-Social = (0,56 x Farmer welfare level Class Value + (0,27 x Involvement of women in agricultural business Class Value) + (0,11 x Level of education Class Value) + (0,06 x Land Ownership Status Class Value)
The equation above produces a cumulative value for each land unit which is spatially represented by a distribution of ecological sustainability values ranging from 0.49 to 0.65 (Fig. 5a). This range of values indicates that the area has serious environmental challenges. This relatively low value may indicate a land degradation problem that requires immediate intervention to prevent further damage. Actions in the form of implementing sustainable agricultural practices, or better management of natural resources are very necessary for sustainable agricultural resource management [44]. The economic sustainability value ranges from 16.85 to 20.03 (Fig. 5b); this shows that there is economic stability, but there is still potential inequality or economic challenges that need to be overcome. Policies that focus on equitable and inclusive economic development are essential to overcome unequal distribution of income and access to economic opportunities that hinder economic growth [45]. Social sustainability scores ranged from 4.11 to 54.65 (Fig. 5c), indicating very significant differences in social well-being and access to basic services in the region. These differences reflect gaps in welfare, education, land ownership and active involvement of women farmers. This inequality may be overcome by increasing access to resources, training, and inclusive empowerment programs, as well as policies that support gender equality and social welfare in the agricultural sector for sustainable development [37].
The formulation of the cumulative equation for the three pillars of sustainable development is as follows:
SP-Corn = (0,63 x S-Ecological) +(0,26 x S-Economic) + (0,11 x S-Social)
The cumulative results above from the equation for the three pillars of sustainable development show a distribution of values ranging from 5.17 to 10.80. These values were then categorized into three priority classes using the natural break method which is known to be effective in grouping data based on its natural distribution to reduce variability within a group and maximize differences between groups [22, 23]. The First Priority Class is a distribution of land that is highly recommended for sustainable corn development which has a value range of 5.17 to 6.05 with an area of 1,614.17 hectares. The second priority class covers a value range of 6.05 to 7.73 with an area of 3,179.05 hectares, which can also be recommended. Meanwhile, the third priority class covers a value range of 7.73 to 10.80 with an area of 147.86 hectares, which requires serious consideration and attention to be used as a sustainable corn farming development area. Grouping land based on priority is a strategic step in planning sustainable corn farming areas that can be carried out in an informed and directed manner [46]. This is presented spatially in Fig. (6).
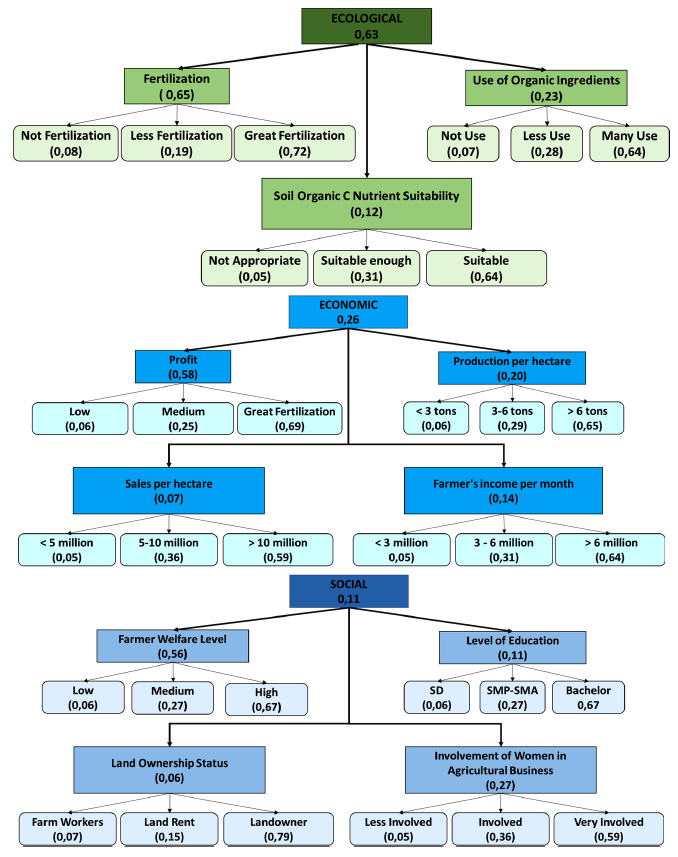
Hierarchical structure of criteria weights and class scores for ecological, economic and social sub-criteria for planning sustainable corn farming areas.
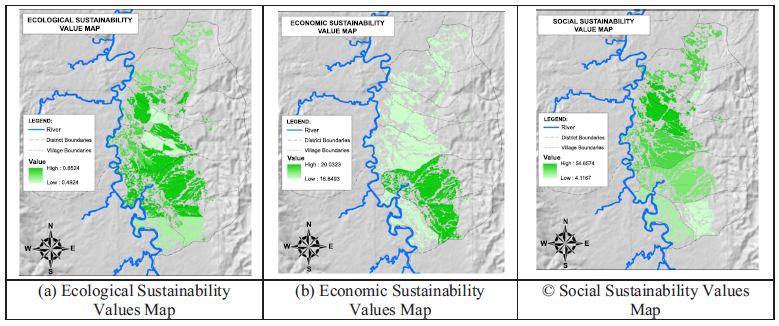
Map of the distribution of S-Ecological (a), S-Economic (b) and S-Social (c) sustainability values.
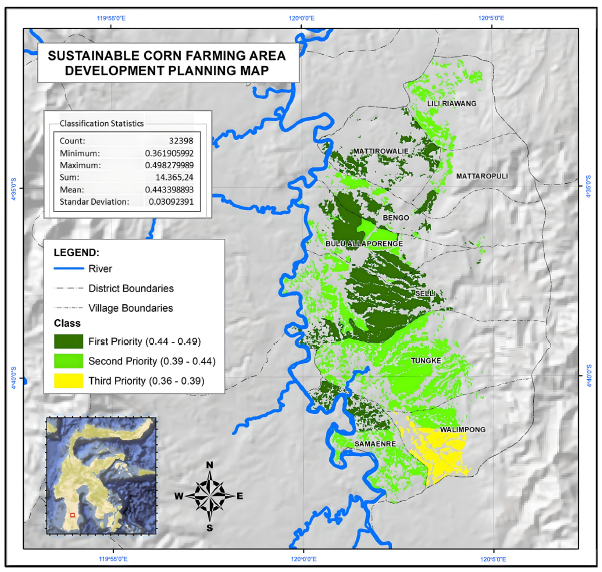
Sustainable corn farming area development planning map.
CONCLUSION
Evaluation of land suitability shows that class S3 (Marginally Suitable) dominates the research area, with limiting factors including obstructed drainage, high levels of base saturation, and unbalanced K2O content. Evaluation of sustainability through RAP-Corn analysis shows that the ecological dimension is less sustainable, while the economic and social dimensions are relatively sustainable. Further efforts are needed to improve ecological balance and improve economic and social welfare to achieve sustainable development. The results of the AHP analysis provide a relevant distribution of weights and scores, which clearly depict preferences. The multicriteria analysis model, which integrates multidimensional scaling and analytical Hierarchy Process, offers a holistic, structured, and informed approach as an alternative to sustainable corn farming planning. The output of this model can formulate priority directions for sustainable corn agricultural development planning.
AUTHORS’ CONTRIBUTION
H.N. and A.H., R.H.: Study conception and design was contributed; R.S.: Collected the data and analysis and interpretation of results were provided. All authors reviewed the results and approved the final version of the manuscript.
LIST OF ABBREVIATIONS
| AHP | = Analytic Hierarchy Process |
| MDS | = Multidimensional Scaling |
| FAO | = Food and Agriculture Organization |
ETHICS APPROVAL AND CONSENT TO PARTICIPATE
Ethical approval for this study was granted by the Research Ethics Committee affiliated with Universitas Muslim Indonesia, Indonesia, with approval number: UMI012503195.
HUMAN AND ANIMAL RIGHTS
All human research procedures followed were in accordance with the ethical standards of the committee responsible for human experimentation (institutional and national), and with the Helsinki Declaration of 1975, as revised in 2013.
AVAILABILITY OF DATA AND MATERIALS
The data sets used and/or analysed during this study are available from the corresponding author [A.H.] upon request.
ACKNOWLEDGEMENTS
Not applicable.